
Lung cancer is the leading cause of cancer-related death, making up almost 25 percent of deaths from all types of cancer in the U.S. However, thanks to positive lifestyle changes such as quitting smoking and advances in research, detection, and treatments, that number is dropping.
Individuals with cancer are at greater risk of developing complications and dying from common illnesses and viruses, including influenza. So, when a research group from Columbia Medical School launched a study to explore the link between lung cancer mortality and flu epidemics, Virtualitics joined the team to provide state-of-the-art data analytics and multidimensional visualization capabilities.
The purpose of this study was first to determine whether a link existed between death from lung cancer and influenza and then to apply any significant findings to increase patient and provider awareness of the danger of influenza infection for patients with lung cancer.
How the Study Was Conducted
The study was conducted using 195,038 patients with non-small cell lung cancer (NSCLC) located across 13 states using data obtained from the Surveillance, Epidemiology, and End Results (SEER) Program and the Centers for Disease Control and Prevention (CDC).
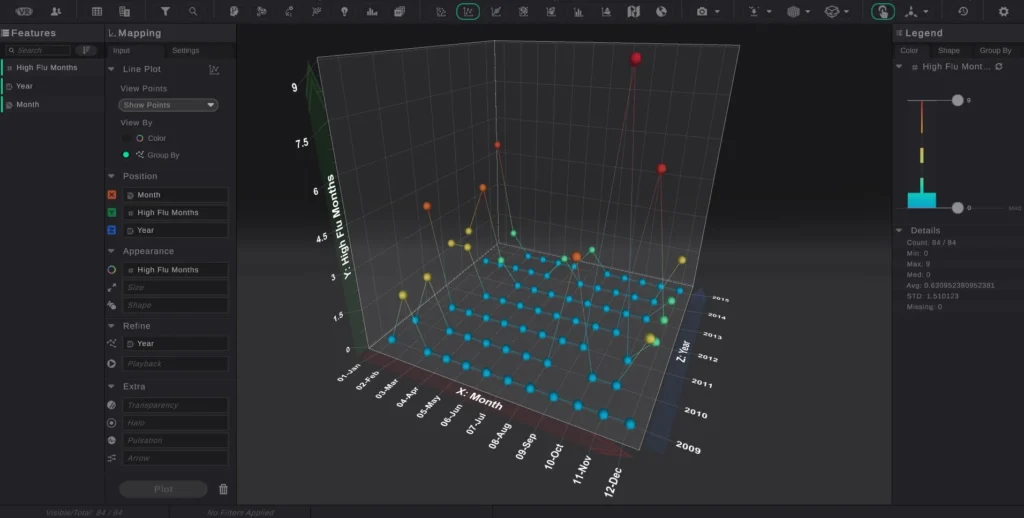
The research team compared monthly mortality rates during the high and low flu months between 2009 and 2015 for all at-risk patients in the study, as well as newly diagnosed patients. Influenza severity level was defined based on the percentage of outpatient visits to healthcare providers for influenza-like illness and matching CDC flu activity levels with SEER data by state and month.
The data was then analyzed using high-dimensional visualization coupled with AI routines so researchers could fully understand and explore the complex relationships within the data.
What the Study Found
The research team observed a significant difference between the monthly mortality rate in patients during high flu months compared with low flu months.
The positive relationship between flu severity and mortality was observed across all study participants, as well as at the individual state level and among new patients, specifically.
The results of the study, which were published in the Journal of Clinical Oncology, proved that increased influenza severity was positively associated with higher mortality rates for NSCLC patients. At the conclusion of the study, researchers indicated that the study’s findings support the need for future research to determine the impact of influenza vaccines on reduced mortality for patients with lung cancer.
3D Visualization and AI-Driven Analytics Enable Research Teams to Get the Most Valuable Information from Data
The Columbia Medical School research team was able to determine that a correlation exists between influenza severity and patient mortality by using three-dimensional visualization and artificial intelligence to analyze and model data. This type of visualization has several key benefits that improve data analysis capabilities across not just research but all industries.
Increase Visibility
Unlike 2D models, multidimensional visualization allows researchers to add and remove variables to measure the impact on the subject and get deeper and more complete insight into the relationships between datasets. For example, during the lung cancer study, researchers examined flu severity level by month and year simultaneously.
Identify Interrelationships
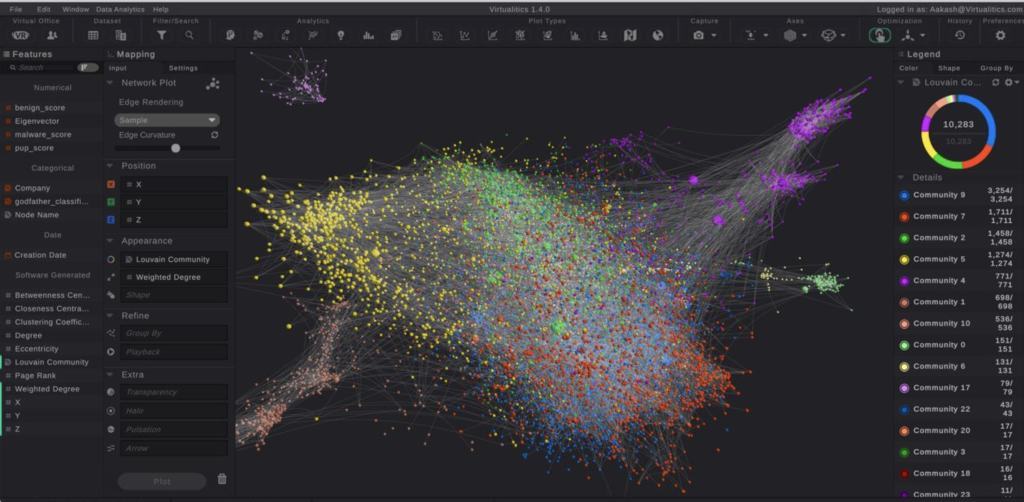
Immersive data analytic technology is essential for identifying patterns, trends, and outliers that researchers can easily miss when the data is only presented in two dimensions. Without the additional plane, critical data points may be occluded that could make a significant difference in a study’s results.
Three-dimensional visualizations can also be applied to unstructured data to enable research teams to gain valuable insight and identify relationships that exist between datasets from otherwise hard-to-analyze, disparate data sources.
Improve Communication
Applying multidimensional visualizations to complex AI and machine learning models allows researchers to display data relationships in a variety of geospatial and graphical visualizations that are easily understood by researchers, data scientists, and the non-scientific community alike.
AI-driven data analytics and 3D visualization tools also enable distributed research teams to collaborate over geographic locations. With collaboration and presentation tools available in both desktop and VR, researchers can work together securely to find, visualize, and share data insights, anomalies, and patterns, no matter where they are located.
Multidimensional visualization paired with the power of AI and machine learning is driving advances in healthcare and medicine. When the Columbia Medical School research team and Virtualitics partnered to tackle the world’s deadliest cancer, they were able to look at the data in a whole new way.
Contact us to learn how Virtualitics AI Platform can help your organization get the most information and value from your data.
Detailed paper:
Influenza and mortality for non-small cell lung cancer. Authors: Connor J Kinslow, Yuankun Wang, Yi Liu, Konstantin M. Zuev, Tony J. C. Wang, Ciro Donalek, Michael Amori, and Simon Cheng. Published on Journal of Clinical Oncology, Volume 37, Issue 15.