AI Platform for
Mission Readiness
The Virtualitics AI Platform Provides a Secure and Consistent Foundation for our AI Applications

Built for Readiness
Engineered for Enterprise
The Virtualitics AI Platform is the powerful foundation for driving readiness at speed and scale. This rapidly-deployable, end-to-end solution enables AI-generated explainability, interaction, and visualization, empowering your teams to explore and engage with data with ease. This AI platform for defense environments is enterprise ready, with a core focus on security, governance, and flexible data integration and deployment methods to meet your mission needs.


Virtualitics AI Platform
A single environment for analyzing data and empowering users to solve mission-critical problems with an AI platform for mission readiness.
Decision
Intelligence

Data
Exploration

Developer
Experience
Data
Exploration

Decision
Intelligence

Developer
Experience
Virtualitics AI Platform
Decision Intelligence
Data Exploration
Developer Experience
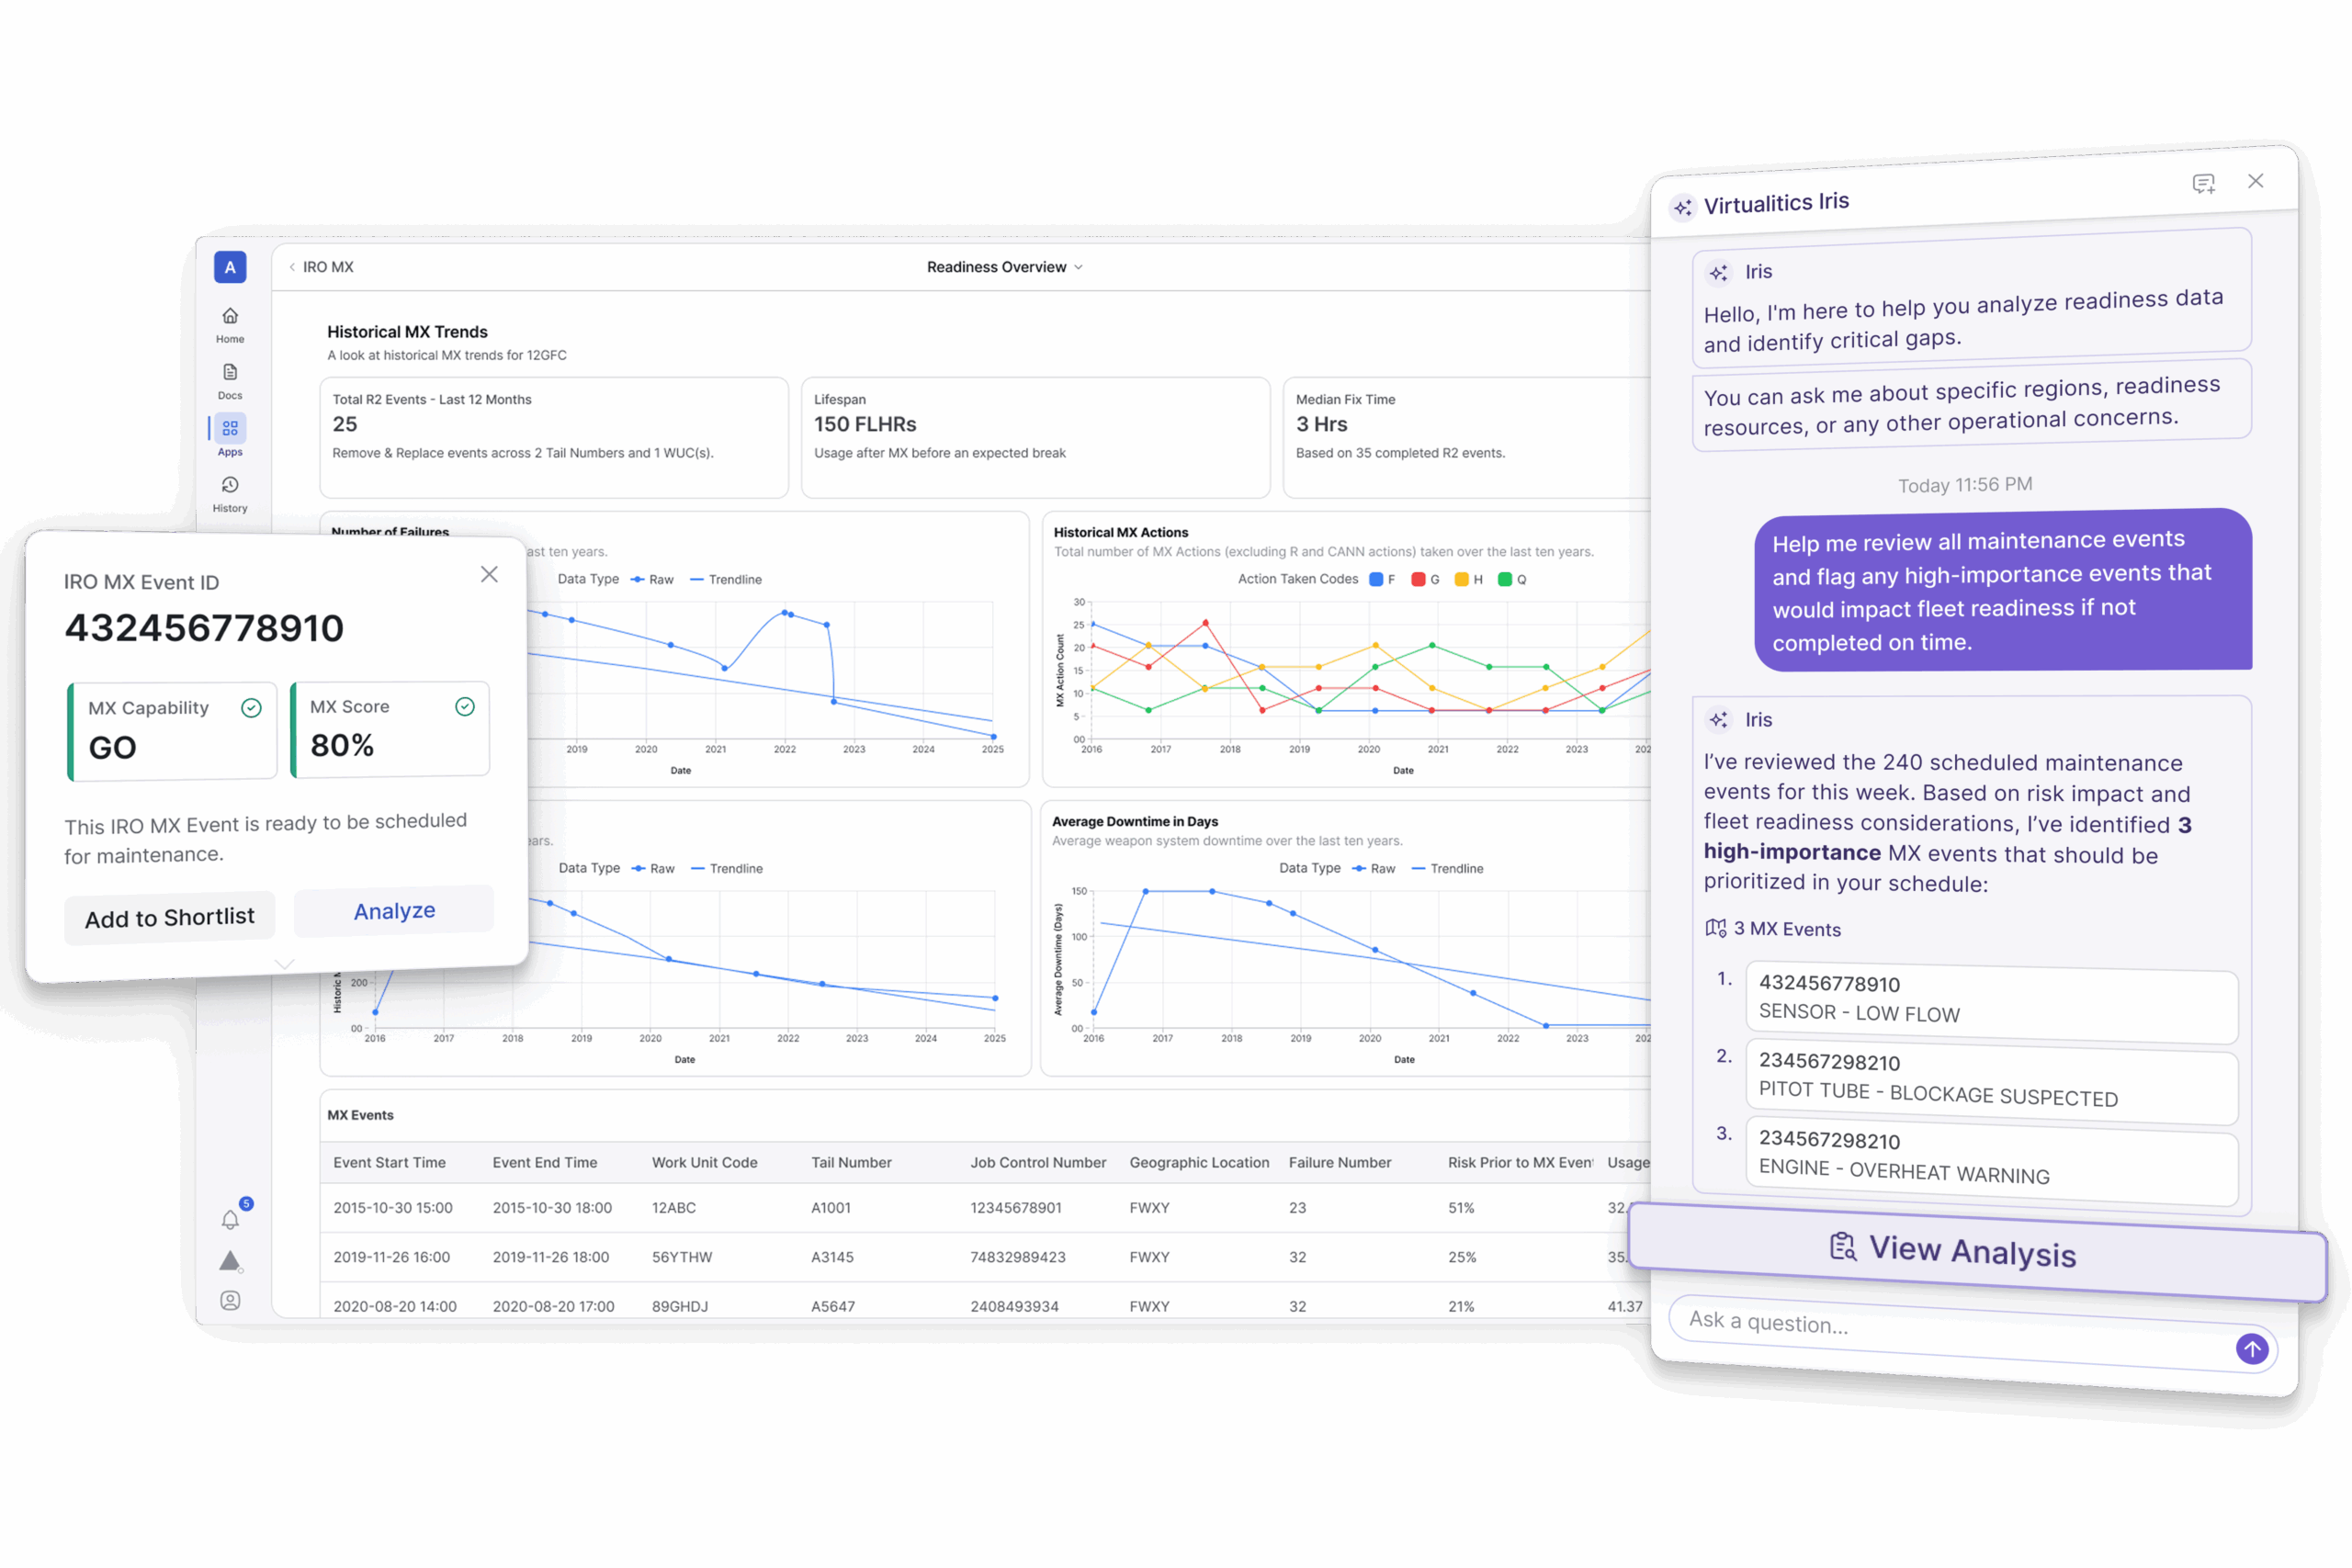
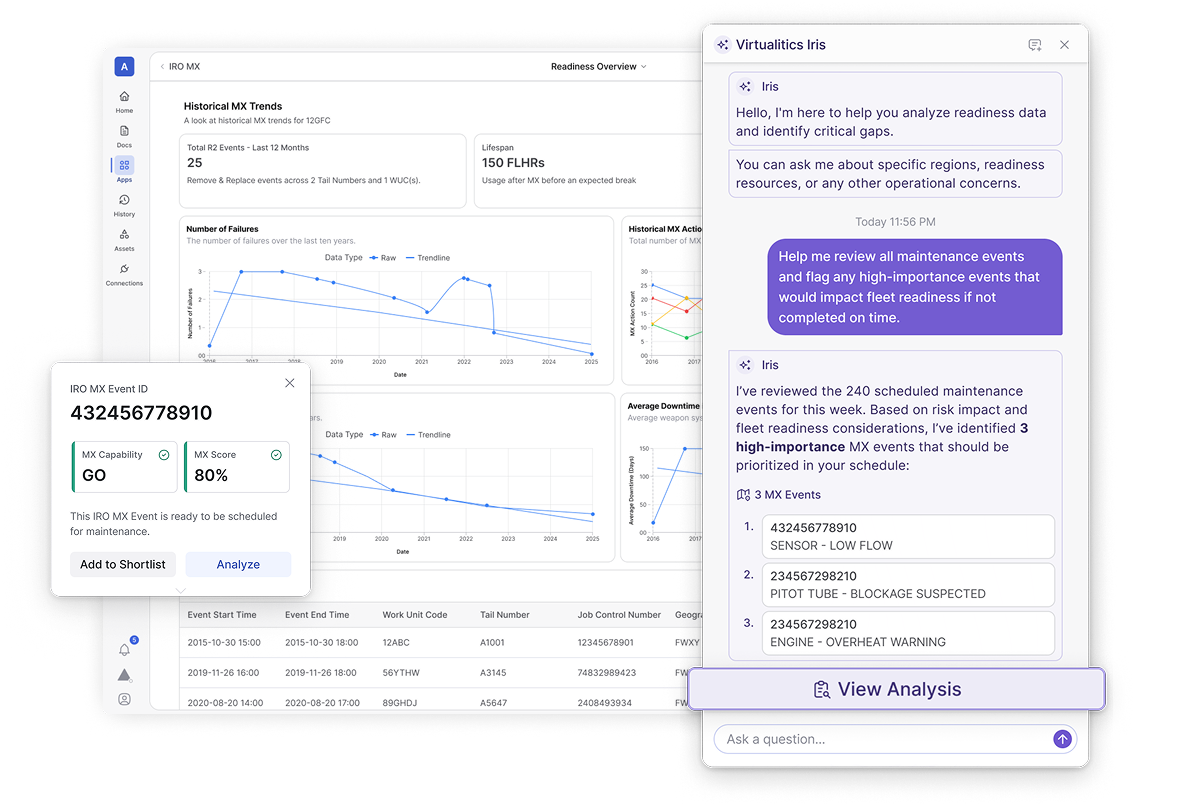
Go beyond BI Dashboards
Seeing doesn’t always mean believing, which is why a traditional dashboard falls short.
The Virtualitics AI Platform empowers users to engage with data through interactive experiences and explainable recommendations.
- Dashboards tell users where their data is and give them options for reporting the current status.
- AI-powered applications help users determine if they have the right data, find substantive evidence, and make strategic decisions based on relevant data.

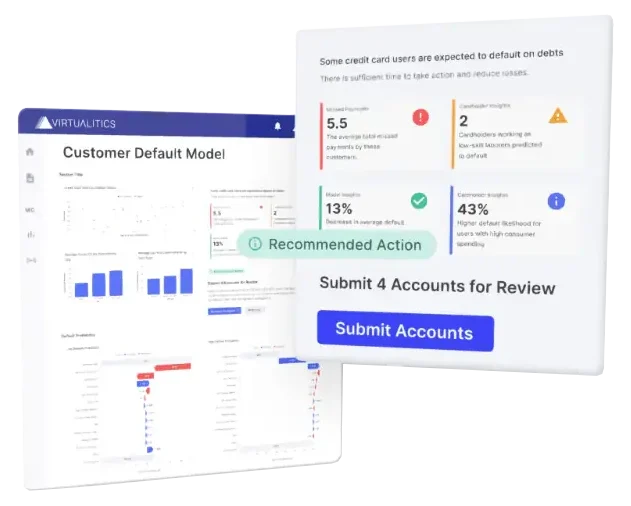
How AI Enhances Data Exploration
Provide AI guidance that uncovers deep data insights while creating data stories that leadership teams can follow.
Our approach to AI uncovers hidden patterns in complex data and generates dynamic visuals and explanations to give you confidence in your next data-driven decision.
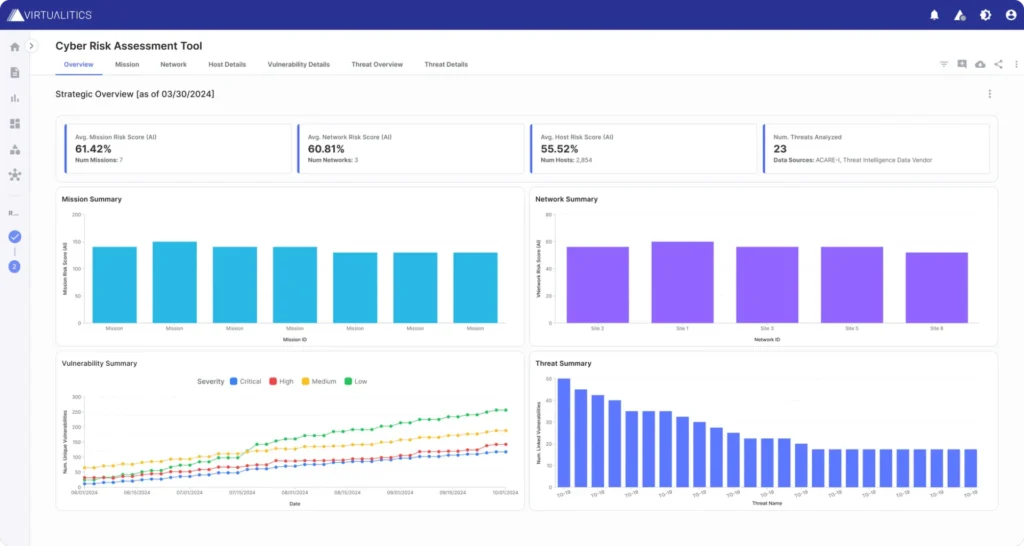
Smart Mapping: Helps users instantly understand the key drivers in their data and presents relevant visualizations of key drivers.
Anomaly Detection: Identifies points that are statistical outliers or have extreme values for combinations of features.
Network Extractor: Enables users to generate Network Graphs from tabular datasheets.
These capabilities strengthen our AI platform for defense decision makers by turning raw data into clear direction.
Building AI is one thing, but building AI for decision enablement in sophisticated enterprises can be incredibly challenging.
The Virtualitics Developer Experience helps teams avoid deployment paralysis and launch impactful AI applications.
Build Interactive AI Applications
The Virtualitics Developer Experience includes an SDK and an API and is ready for enterprise-level business from the start. You have the ability to create your own AI application to reside on our platform.
- Create within a pure Python low-code environment
- Develop experiences and explanations around AI and predictive models to inform decisions
- Utilize interactive software that goes beyond dashboards
Build AI Agents
Build AI Agents to support any solution. Utilize our GenAI Toolkit as a foundation for AI agent development.
Includes:
- Readiness Sigma (RSIG): Condenses large groups of reports to surface key insights fast.
- Retrieval-Augmented Generation (RAG): Connects secure, trusted data sources to GenAI models for grounded responses.
- Containerized LLMs: Deployable on any approved system, keeping sensitive data protected and models mission-specific.
- Developer Interfaces: Enables easy integration of GenAI capabilities into AI applications running on the Virtualitics AI Platform.
AI-Powered and Mission Ready
Together, these features define a reliable, enterprise ready AI platform for defense built to support mission success.
Security & Governance
Tracking, automation, and governance for your Apps, Data, and Models.
Account Management
Manage enterprise users with ease and granular access controls.

Data & Deployments
Flexibility around deployment and data connectors to streamline your adoption.

Ready to accelerate decision-making and strengthen operational outcomes?
Request a Demo