Sampling is unavoidable when we’re dealing with big data. The only way to find meaning from a large dataset is to make it smaller, and more manageable. However, data sampling can result in a biased or unrepresentative cross-section of data…which leads to inaccurate or misleading results. What we need is a way to generate a random, useful data sample that reveals powerful insight without making us slog through more data than we need to.
While there are algorithms for generating a random sample, they’re not always suitable to the dataset or the analysis that needs to be done. Moreover, on a massive dataset, they can take a lot of time. This leads to sampling shortcuts, and that leads to sample bias.
For example, if you listen to playlists on random you’ve probably noticed that one or two songs always seem to play more often than others. For music streaming, this isn’t a huge deal. But when we’re talking about a sample of data that you’re going to use to draw conclusions and build business strategies, it’s important to have the right sample.
So what does it really take to create an appropriate sample from your data? The answer to that question is pretty complicated.
There is no one perfect approach.
The right sample is dependent on your goals, so you can’t use the same process every time. Not very efficient, right?
Selecting an appropriate sample requires specific skills.
Data analysts don’t usually have the skills to generate data samples. Data scientists do have the skills to write code to find viable samples in big data, but is this their highest priority? Probably not. Because…
Producing a great sample takes time.
Writing sophisticated code and processing massive datasets takes time. And it’s probably time that your data scientists don’t have. So choices are made, and it’s likely that analysts are left working from unrepresentative samples.
Why is it so difficult to find a great sample in big data?
It’s really hard to select a great, representative, unbiased sample because there are a lot of opportunities to make mistakes. But you can’t base your business strategy and future projects on half-baked data analysis.
A data scientist who sets out to build a great, representative sample knows there are tripping hazards just waiting in the wings:
Bias. Data sets may contain inherent biases that can affect the accuracy of the sample. For example, if a data set contains more data from certain regions, certain demographics, or certain time periods, a random sample may not accurately represent the entire population.
Dimensionality. Big data sets have a large number of variables, making it difficult to choose a representative subset for sampling. Choosing the wrong subset would lead to inaccurate conclusions.
Variability. Massive, complex data sets include a high degree of variability, making it difficult to draw conclusions from a small sample. For example, if the data set contains many outliers or extreme values, a small sample may not capture the full range of the data.
Overall, getting a good, useful sample in a massive, complex data set requires careful consideration of these factors, as well as an understanding of the underlying data and research questions. But the sheer effort will take a toll on your data scientists.
What if you could manage all of your big data?
Let’s walk away from the obstacles and consider what you could accomplish with a really great data sample. If you had a sample that you trusted to be random and representative, you’d be able to apply the right strategy to each problem or opportunity that you face. Your business leaders would be able to understand the real potential of new projects that are being considered. And your data science team would be preserved and prioritized for activities that matter the most.
Instead of burdening your data scientists with the task of creating the right data sample, we recommend using AI to find a truly useful data sample from your vast datasets…and to do it really fast. Virtualitics has built a collection of applications that will help you do just that, and we can’t wait to introduce it to you in the coming weeks. Follow us on LinkedIn so you don’t miss the announcement! And if you’re ready to learn more about Virtualitics just request a demo and we’ll be in touch.
Customer churn is one of the most expensive issues businesses face. Customer loss impacts businesses of all sizes in every industry. Attrition means millions of dollars in lost revenue and increased customer acquisition costs. To tackle churn, you need to be able to pinpoint who is leaving… and why. And as it gets more competitive out there, getting to a precise answer is more important than ever.
Frustration around customer churn is real—and so are the immediate and future costs:
- A study by Bain & Company showed that increasing customer retention rates by just 5% can increase profits by 25% to 95%.
- The average cost of acquiring a new customer is 5 to 25 times more expensive than retaining an existing one, according to Invesp.
- According to a study by Deloitte, companies that prioritize customer experience are 60% more profitable compared to those that don’t.
Small improvements in customer churn can have massive impacts on business performance. A study by Retention Science found that a 1% increase in customer retention can result in an increase of 5-95% in profits, making customer churn a very profitable challenge to overcome.
Stemming customer churn requires targeted solutions aimed at the right customers and acting on hunches or the eye-catching number in your SalesForce dashboard won’t get you there. More importantly, it definitely won’t help you determine which customers are worth the extra effort to retain.
Identifying the true causes of customer churn
Often, customers are more than willing to tell you why they’re leaving. Feedback and reviews are plentiful, and the internet provides a platform for people to share their opinions on almost every product they own. Some of the most common complaints are product quality or price. But assuming that all of your customer churn problems are that simple is doing your business a disservice.
Communication, customer service, and engagement also play a large part in customer retention. This type of feedback can be difficult to evaluate and analyze. “5 stars” is one thing, but details about service, ease of use, longevity, and quality are harder to consider alongside numerical ratings.
Intelligent, unbiased data exploration can help us identify the real trends and connections in our customer data without becoming sidetracked by a loud problem that might not be the real driver. Instead, there are two questions we should be asking: why are customers churning, and which ones are churning the most?
Finding the “why” of customer churn
Analyzing customer churn is a time when bias and assumptions can easily sneak into our strategies. Do we let a vocal minority (either positive or negative) drive our retention strategies? It’s tempting, but it’s likely that we’ll put too much weight on the wrong input while neglecting the silent but significant drivers. User reviews can also be skewed by personal bias from your customers, as well as public perception.
That doesn’t mean your data and customer reviews aren’t valuable. Considering the reasons why customers claim they’re leaving is important in addressing customer churn and retention. But reasons like “poor customer service” or “negative user experience” don’t tell the whole story. Customer feedback is typically one-sided and doesn’t consider if there were steps the customer should have taken to get more value out of the product. We need to combine “why” customers leave with “who” those leaving are.
Understanding the “who” of customer churn
When we move beyond common groupings such as geography, salesperson, or purchase date we can consider who our customers are based on their behavior, not arbitrary identifiers. A group of customers that churned may be from the same area or have worked with the same sales team, but what about their behavior?
Consider a group of customers that cites difficult user interfaces as their reason for leaving. If you investigate the customer data you might discover that these users never completed their training, didn’t engage with customer support, or didn’t engage with product tutorials. So instead of placing blame on the product or the sales agent, teams can emphasize the importance of training, provide more product demonstrations, and make sure customer support agents are prepared to assist at the appropriate times.
Customer groups need to be defined by their actions, not just their reviews.
Identifying the customers worth saving
While we know that overall customer churn is detrimental to a business, that doesn’t mean every customer is equally impactful. It’s important that companies use their data to build a solid understanding of their customers, their behavior, and their potential. That’s not just about simple spending data. We’re talking about questions like:
- What kind of customer produces ongoing revenue and is worth pulling out all the stops to keep?
- Which customers can walk away because the cost to keep them outstrips the revenue they bring in?
- What’s the biggest reason why a high-value customer might leave?
- When the signs point to a customer leaving, how long do we have before they decide to leave?
An Example of Customer Churn Analysis
Consider a B2B retailer that was experiencing the greatest customer churn in the northeastern region. A first inclination was to put pressure on the regional manager to stanch the bleeding. But this region also had the highest sales–the high churn was directly correlated to their higher overall volume, not a shortcoming in the organization.
When the company removed geography as a driver in its analysis of churn, the real culprit emerged: customers that did not complete product certifications were the most likely to leave, regardless of where they were located.
Exploring further, a network graph revealed that 90% of customer churn was happening in two of the 12 communities identified. The company identified the community that would be most expensive to lose and focused on strategies to increase certification rates in this group.
Data did the talking. It found a systemic problem that could be addressed. The discovery led headquarters to recognize how critical the certification program was and to consider strategies like discounted certifications that could be rolled out company-wide.
Getting smarter about customer churn
Most organizations already have the data they need to understand customer attrition. What they lack is the means to sift through it and then explain the insights to customer success teams. AI-driven data exploration is made for just this sort of job. It can help you get out in front of churn—and stay there.
Join us for a webinar on “Unlocking the Secrets of Customer Churn: A New Approach with Intelligent Exploration” on Tuesday, February 21st, to see how Virtualitics is using AI to guide users through their customer data to the insight that will help them keep their most valuable customers.
Multitasking? Great! You can listen to this blog post by clicking above or find our podcast, Intelligent Data Exploration, on major podcast platforms.
Businesses spend a lot of time, effort, and resources to collect and store data. But the information they gather doesn’t make an impact sitting in the cloud. It’s the relationships and drivers that the data can uncover that guide transformative business strategies. With datasets growing exponentially in volume and complexity it’s becoming incredibly difficult for data scientists and analysts to locate and understand the most impactful data relationships—and ultimately communicate them to stakeholders.
That’s where network graphs come in.
Network graphs are visualizations that capture the connections and relationships in data. Those relationships are shown using nodes and edges, where nodes represent what is being analyzed and edges show how those nodes are connected.
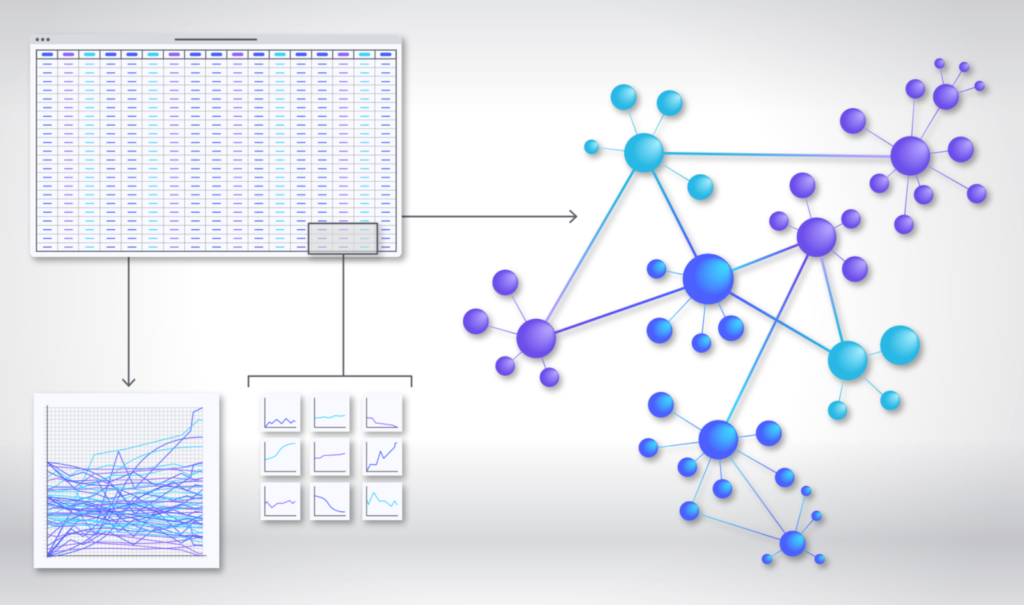
Where traditional BI tools like spreadsheets and 2-dimensional graphs can show limited relationships, they lack context and the ability to compare one relationship to another. Network graphs are capable of showing many relationships—and the magnitude of those relationships—at the same time.
Why do network graphs matter? Your data has important things to tell you about your customers, equipment, logistics, and outcomes. Data-rich network graphs enable teams to identify root causes, manage risks, and make impactful decisions based on the communities and behaviors they discover. In short, great network graphs are your map to identify and refine successful business strategies.
Great data science is being held back by outdated technology
The science of network graphs has been around for the last couple of decades, but they have relied on a lot of heavy lifting from data scientists, complicated technology stacks, and flat visualizations that don’t fully communicate the rich insight within. As a result, few organizations have started to take advantage of them as part of their data and analytics strategy.
Most exploration is still done using traditional BI analyses, which don’t capture the relationships between multiple data points. Limiting the data you explore, and how you explore it, introduces risk and reduces value since you’re missing the relationships within that portion of your data. Your data’s quantity and complexity are an asset, as long as you explore all the possibilities.
From pivot tables and charts to networked communities
Consider the example of a dataset from Pew Research Center that surveyed people about their social media use. They gathered responses to 40 questions, including demographics (age, gender, marital status, etc.), their current internet or cable TV providers, whether they have a smart device, and whether or not they use a multitude of social media platforms.
Some of the Pew Research findings looked like this:
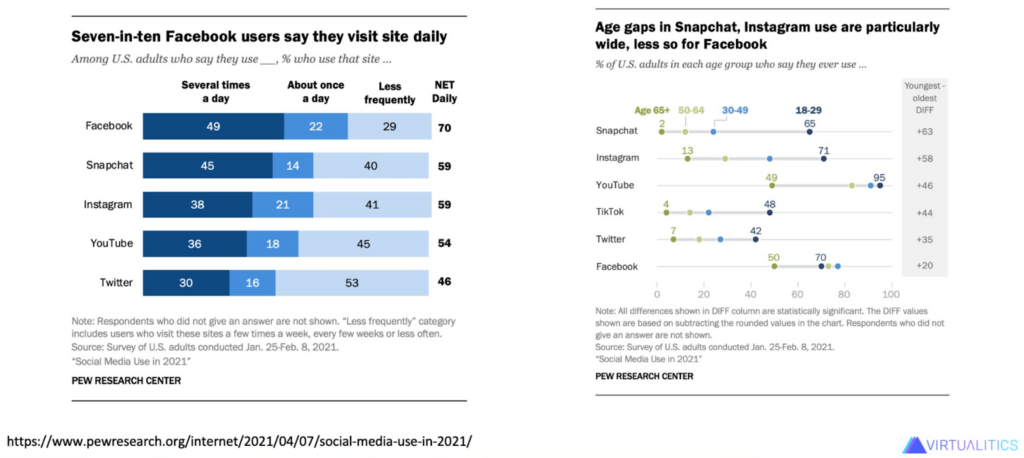
Interesting information, but you’re missing the interactions between dimensions. Who is using Facebook most frequently, and what resources are available to them? What else do TikTok users in their 40’s have in common? Do Twitter users share a similar profession or education level?
We have a lot of data but our knowledge of user behavior is still pretty light. If you’re an advertiser or marketer trying to reach a specific audience, you’d benefit from having more information about the communities hiding in your data. What’s the point of having so much data collected (remember, 40 data points!) if we don’t look at the relationships between responses?
We took this dataset and used the AI within our platform to create a network graph showing the communities of respondents. Our Network Extractor quickly sifted through all the data, grouping respondents together based on their similarities and differences to build nine distinct communities.
Our network graph showed us things like:
- Young people make up the largest community, even though they were underrepresented in the survey, suggesting that their responses are consistently very similar. We’re confident that their behaviors are a good standard for their community. We expect this community to use all of these platforms, and to use them frequently.
- There are three groups at the top of our network graph: Doesn’t Use Internet (green), Low Internet Use (peach), and Low Income (light blue). These groups are all characterized by low or no internet use. The “no use” community is very tightly grouped, sharing many of the same behaviors across respondents.
- There is a group of people who identify as regular readers. You might hypothesize that this community would be less likely to spend time on social media, however, the group’s positioning with the other communities characterized by internet use suggests that they are still regular internet users.
The power of network graphs is the ability to see all of the relationships underlying a business problem in their full complexity, identify the most valuable relationships, accurately understand the drivers of those connections, and use AI to discover all the what-ifs.
Practical examples of network graphs
Network graphs are incredibly versatile, showing relationships between a massive variety of data points. Here are just a few ways they can be used:
Manufacturing and energy
Consider the incredible networks and relationships within the transportation industry. A commercial airline is responsible for making thousands of decisions, from fuel planning to supply chain selection to pricing strategies. Network graphs can help them see how choices and trade-offs impact their overall goals.
Financial services
Banks handle massive numbers of users, transactions, and applications each day. The related data includes a variety of demographics, characteristics, and behaviors. Financial providers could use network graphs to find unbiased trends in loan applicants, detect fraud, or target ideal borrowers.
Supply chains
A supply chain can be impacted—for better or worse—by so many variables. If you want to expedite deliveries or introduce a new route how do you know what that might impact? Network graphs can illustrate those relationships, and find more that you might have missed.
If you’d like to learn more about these examples and the power of network graphs combined with AI-guided exploration check out our free e-book A Beginner’s Guide to Network Analysis or set up a live demonstration to see our platform in action.
Gartner® says Virtualitics is a Cool Vendor for Analytics and Data Science, with technology that enables users to do things they couldn’t do before.
Who’s cool now?

A lot of us can look back and remember those awkward uncool years. Just ask Aakash Indurkhya. This was his actual grad quote. He’s now our co-head of AI.
So, it’s pretty gratifying for Virtualitics to be listed as a Cool Vendor. We see it as validation that we’re in the lead on some really useful technology for those “who want to sift through big data to investigate complex systems using out-of-the-box machine learning (ML),” as Gartner® puts it.
Being cool means being out ahead.
It’s about not looking and sounding like everyone else. It’s having the spotlight find you even though you’re not looking for it, because, well, you’re cool.
That’s why we are pumped about some big news: Virtualitics has been recognized as a 2022 Gartner® Cool Vendor for Analytics and Data Science.
You can’t apply to become a Cool Vendor. Nominations come directly from Gartner® analysts who are experts in specific markets and the vendor landscape. The companies who are deemed Cool have developed technologies/products that enable users to do things they couldn’t do before, that anticipate market direction and need, and that have or will have business impact. Gartner analysts speak with multiple customers actually using the technology to make sure the product works as advertised and verify they are getting value. And just a few vendors in a given tech category get recognized in any given year.
Virtualitics is one of only three companies selected for this year’s Gartner® Cool Vendors in Analytics and Data Science. Here are a few of our capabilities Gartner® singles out:
- An immersive platform that brings a bit of the experience of real-time gaming to analytics. Like a shared virtual reality (VR) office where users can stand inside of and touch a dataset.
- Ability to combine up to ten dimensions of data versus two, and deliver complex analyses of them in visually compelling ways.
- A workflow experience that moves users seamlessly from discovery to analysis to action. Teams can collaborate from anywhere, including mobile devices, visualize what lots of complex data is saying, then act on it, right in the dashboard.
- No coding skills required.
Reach out to learn more about how we empower business decision-makers, subject-matter experts, analysts and citizen data scientists with practical AI to understand patterns. “Without needing expert data scientists to code and maintain predictive models,” in Gartner®’s words.
Read the full Gartner 2022 Cool Vendor Report or request a demo and we will give you a tour of the platform.

To achieve data-driven decision-making, you need all relevant data. The power behind prediction is the past. In any type of predictive AI modeling, you can’t derive insights and forecast the future of what will likely happen without including historical and current data.
But what is the easiest way to use this past data, and what considerations should you keep top of mind?
How Predictive Analytics Works and Why It Requires Past Data
Predictive analytics is an approach that organizations use to understand and identify patterns and trends from historical and current data. It leverages the data itself along with statistical modeling, machine learning, and AI.
From this analysis, you can detect both risks and opportunities, depending on the questions you’re asking. You may also find relationships between variables. For example, a popular use case for predictive analytics is consumer behavior patter analysis.
By including past and current data, companies can better predict what factors influence purchases and then personalize promotions to elicit the expected outcomes.
Without the knowledge of past consumer behavior data, it would be impossible to make such predictions. Garnering these insights is a smart tactic for businesses. A study by the Aberdeen Group as reported by Emerj found that companies that use predictive analytics were twice as likely to be able to target high-value customers and market their products to them exceptionally.
Although predictive analytics isn’t accurate 100 percent of the time, it is much more reliable than a hunch or an assumption. It paves the way for making critical decisions based on data. But how do you effectively group all your datasets?
How Does Data Ingestion Work?
To make sense of the data and make predictions, you have to feed the models data. That’s not always easy. Data can live in many places and be in various formats. The best way to approach such a task is to use a predictive modeling platform.
If your tool does these things, it will be relatively easy to move your historical data into a new environment where it can deliver actionable insights.
Predictive Analytics Platforms Allow You to Gather Data from Unexpected Sources
You may have third-party systems that hold lots of valuable past data, but exporting the data is not necessarily a perfect solution. In some cases, you may not have export access at all. What do you do then? In these situations, an integration will be necessary so that the two systems can exchange data.
If this is a top concern and has been holding you back from using predictive analytics, you’ll need to ask the right questions of both application owners. It is typically possible to integrate, and we’ve been able to do that for our users, including those who adopt our predictive maintenance solution.
Another concern may be integrating a data source that’s constantly changing, such as weather information. This kind of complex integration is critical in predictive maintenance because it can be a factor for assets in challenging environments. However, this concern shouldn’t limit you.
The bottom line is that most companies need to incorporate many data streams, and they won’t all behave in the same way. The key is to find a platform that can make this happen efficiently and effectively.
Discover the Power of Predictive Analytics with Diverse Data Sources
Predictive analytics can be a game changer for organizations. It can increase sales, reduce costs, mitigate risk, and much more.
To see the powerful results such a model can have, read our aviation company use case. The company used Virtualitics Predict to save $6-15 million in annual maintenance costs.
Within the AI ecosystem, there are different models. One such branch is explainable AI. So, what is explainable AI, exactly?
Explainable AI is a set of processes and methods wherein human users can understand and trust the results from machine learning algorithms. It describes a model, its expected impact, and potential bias.
By using it, you can gauge the accuracy, transparency, fairness, and outcomes of AI-driven decision-making. As a result, human users can explain and comprehend algorithms, deep learning, and neural networks by leveraging this model.
The Importance of Explainable AI
AI systems are notorious for having a “black box” nature due to the lack of visibility into why and how AI makes decisions. To solve this dilemma, explainable AI offers the solution. Many enterprises realize its necessity and how essential it is for adopting AI and ensuring it delivers value.
Here are some key benefits of explainable AI:
- It operationalizes AI so that it’s reliable, dependable, and consistent.
- You’ll enjoy a faster time to results.
- Keeping your AI models explainable delivers transparency, mitigating risks associated with regulations and compliance.
- You can cultivate trust around the AI models put into production.
- With explainable AI, you can adopt a responsible approach to AI development.
- Developers can be sure that systems are working as expected.
- It offers a way for those impacted by the outcomes of the models to understand and possibly challenge them.
- Rather than blindly trusting AI, you can now have accountability parameters.
Explainable AI also delivers actual value to the organizations that use it. A recent study of its use revealed that it could increase profitability by millions, reduce model monitoring efforts by as much as 50 percent, and increase model accuracy by up to 30 percent.
With so much to gain with explainable AI, what are the top use cases for it?
Explainable AI Use Cases
Should you make explainable AI a focus? How can explainable AI impact your business and its usage of the technology? Here are some use cases to consider.
Logistics: Increase Safety and Efficiency
With a trusted model that is deeply understood, AI in logistics can:
- Increase safety
- Improve efficiency
- Minimize the effects of labor shortages
- Automate warehousing
- Support predictive maintenance
- Mitigate supply chain disruptions
- Manage freight more effectively
As the industry deals with so many challenges, explainable AI models can drive better decision-making based on data.
Transportation: Improve the Efficiency of Routes and Workflows
Transportation is another industry that can benefit from explainable AI. Many factors go into devising the most efficient routes and workflows. The sector can apply AI to improve traffic management, drive predictive maintenance to minimize downtime, optimize routes, and forecast demand.
Industry 4.0: Capture Data and Drive Actionable Insights
Industry 4.0 and sensor data are ideal for explainable AI models. For manufacturers to achieve Industry 4.0, they must implement Internet of Things (IoT) devices and sensors to gather data. As data flows in, AI can evaluate it, leading to actionable insights. Such a model can empower decision-making, improve quality and safety, simplify unstructured data, and enable predictive maintenance initiatives.
The Challenges Organizations Face in Deploying Explainable AI
Many businesses understand the value of AI and machine learning but run into significant challenges when attempting to adopt the technology. The most prolific ones are:
- Legacy systems: Integration and compatibility issues occur with older applications. To overcome this, you’ll need to modernize systems.
- Data quality: Models can’t decipher if data is “good” or “bad.” If it’s inaccurate or outdated, the models won’t be accurate. Having data quality initiatives in place is thus imperative.
- Knowledge gaps: Many companies don’t adopt AI because they don’t have the technical talent to manage it.
- Silos of operational knowledge: Organizations often place data in silos, making it tricky to identify interrelationships. Removing silos is critical for accurate AI models.
Removing these barriers isn’t always simple. However, with the right data visualization platform, you can overcome these. With 3D visualizations, you’ll have a deeper understanding of your models, and they can fit within your existing ones. Additionally, a flexible, agile solution can aggregate data from multiple sources in any format and clean up data before analysis. It can also be easy to use, eliminating the need for data scientists.
In 2011, the German government coined the term “Industry 4.0” to describe the growing application of automation and data connectivity to manufacturing and industrial processes. Today, the Fourth Industrial Revolution is in full swing, and machine learning is playing a pivotal role in advancing the movement.
Talk of artificial intelligence in manufacturing and industrial settings has always sparked fears that human workers will become obsolete. However, in practice, machine learning creates an opportunity for humans and technology to work in concert to achieve greater efficiency, resilience, and consistency.
The Demands of Industry 4.0 to Leverage Machine Learning
The power of applying machine learning to industry lies in the ability to leverage data in ways the human brain cannot accomplish alone. For the industrial sector to take advantage of machine learning, it requires historical and live data collection from various streams, aggregation of data from disparate sources, and integrated platforms for data analysis and 3D visualizations.
For example, a general Industry 4.0 use case may entail the following steps:
- Data is collected from sensors located at critical points in the manufacturing process.
- The data is transferred to the cloud, where it is analyzed using machine learning algorithms.
- The system generates multidimensional visualizations that provide a 360-degree view of the data, including process efficiencies and performance roadblocks.
- Operators use this information to trigger maintenance or optimize functions within the process.
At a broader scale, machine learning helps manufacturing and industrial organizations do everything, from better understanding their users’ needs to proactively initiating equipment repairs that prevent breakdowns in mission-critical systems.
The Impact of Machine Learning on Manufacturing
Machine learning enables systems and algorithms to improve by “learning” from experiences. This continuous adaptation in response to new and updated information allows manufacturing organizations to optimize their operational efficiency and their processes.
In recent years, machine learning technology has paved the way for smart factories. These highly connected facilities use Internet of Things (IoT) devices, sensors, software, and analytics to digitize the manufacturing process, continually monitoring production performance and capturing data. With this high volume of extremely targeted data available for analysis, machine learning enables stakeholders to make more informed decisions that result in more successful business outcomes.
6 Ways Machine Learning Makes Industry 4.0 Smarter
1. Real-Time Quality Control
Machine learning reduces incidents of manufacturing defects and quality issues by integrating with video streaming devices and smart sensors to assess product quality in real time throughout the manufacturing process.
Operators receive alerts about potential issues during production so they can correct them early. This level of inspection and error detection wouldn’t be feasible if it had to be done manually, so machine learning helps improve product quality and, by extension, customer satisfaction.
2. Reduced Downtime with Predictive Maintenance
Machine learning enables predictive analytics, which, in turn, makes predictive maintenance possible. Sensor-equipped components feed performance information to the machine learning system. Using AI routines and algorithms, machine learning tools detect the need for maintenance before a breakdown occurs, which minimizes downtime and reduces the expense of unplanned repairs.
3. Improved Performance
Pinpointing the root cause of performance issues can be tricky. Machine learning algorithms take data from equipment sensors and other unstructured data sources and create visualizations that make it easier to isolate the cause of problems within the system.
By identifying patterns and relationships that are often hidden within the data, machine learning tools make it possible to see how different system components and environmental factors impact performance so operators can quickly correct issues at the source.
4. Autonomous Machinery
Warehouse and factory work is notoriously dangerous for humans. Machine learning enables robotic operators to take over repetitive or high-risk tasks, which makes manufacturing and fulfillment processes safer and more efficient.
5. Demand Prediction
Miscalculating demand can lead to wasted time, effort, and product at one end and product shortages and customer dissatisfaction at the other. Machine learning allows operators to track and monitor historical data for demand and other influencing factors. This insight makes forecasting more accurate so production can be adjusted appropriately to reduce waste and maximize revenue opportunities.
6. Inventory and Supply Chain Management
Industry 4.0 relies on automated inventory and supply chain management tools to drive efficiencies and mitigate risk. Machine learning and IoT services provide real-time insights and visibility into inventory and supply chains so operators can identify bottlenecks early while proactively maintaining appropriate inventory levels.
Achieve Greater Efficiency, Productivity, and Reliability with Machine Learning
In today’s highly connected business environments, data is king. For the manufacturing and industrial sectors, machine learning makes it possible to harness the power of data to increase efficiency, increase critical system availability, and reduce costs.
With the rise of Industry 4.0, AI-driven visualizations are democratizing data analytics by making data accessible and understandable for all stakeholders, not just the data scientists.
Data isn’t just for business intelligence anymore; it’s a highly valuable corporate asset. In today’s enterprises, data is being used to advance the business and drive decision-making in many different ways.
For example, marketing and sales teams use data to target their marketing efforts and identify new opportunities for growth. In the logistics and transportation industries, data saves businesses money by allowing them to predict maintenance needs and optimize routes and fuel usage.
Even utility companies are harnessing the power of data analytics to forecast load and make cost-saving adjustments to power generation.
Why Effective Data Management Is Critical
Because data has become such an essential business commodity, how your organization manages its data matters more than ever.
The ubiquity of smart devices for business and personal use paired with increased adoption of the Internet of Things (IoT) and accelerated Industry 4.0 initiatives, there is a historically large amount of data being generated worldwide every day.
Although this data has the potential to provide high value to the enterprise, the data is really only useful if the business can extract meaningful, actionable information from it. All of this data must also be stored and backed up securely, which adds expense and complexity to data management.
Unstructured Data Advantages and Data Management Challenges
Many of today’s data management challenges stem from the fact that up to 90 percent of the world’s data is unstructured, and that number is only going up. According to some predictions, the amount of unstructured data will increase to 175 billion zettabytes by 2025.
To fully appreciate how unstructured data is impacting and changing the future of data management, it’s important to understand where the flood of unstructured data is coming from.
There is no question that we live in a connected society. Almost everything we do—from collaborating with coworkers to shipping inventory to heating and cooling our offices—is enabled and improved through the analysis of unstructured data.
Enterprises across many industries rely on unstructured data generated through:
- Analytics from AI and machine learning algorithms
- Sensor data
- Functional data from IoT devices
- Geospatial data
- Weather data
- Surveillance data
- Productivity applications
- Text files (e.g., emails, spreadsheets, chatbots)
In fact, it is almost impossible to run a successful business today without accessing, analyzing, and visualizing the insights found within your unstructured data.
Main Challenges of Unstructured Data Management
Along with providing highly valuable business intelligence, unstructured data also presents some significant data management challenges.
Expense
Although the cloud is often touted as a low-cost alternative to traditional, in-house data storage solutions, the massive quantity of data that organizations are managing today can significantly increase costs for cloud-based storage.
To keep storage expenses in check, it’s helpful to evaluate all of your organization’s data and create separate storage strategies for data that is largely unchanging and data that is accessed and modified frequently.
The unchanging or “cold” data can be stored in unmanaged cloud-based storage, freeing up your budget for storing the “hot” data that requires regular backup and replication.
Legacy data management systems are another potential source of extra outlay. Legacy systems often do not play well with modern unstructured data management solutions, which can require custom-building a solution to effectively process and manage high volumes of unstructured data.
Complexity
Unstructured data also introduces additional complexity into enterprise data analytics. With a large amount of raw, unorganized data flowing in from many disparate sources, indexing is difficult and error-prone due to unclear structure and lack of predefined attributes.
This disorganization and lack of well-defined attributes makes it difficult for analysts to determine which datasets are relevant to a particular use case and whether the data is high-quality and trustworthy.
How Investing in Unstructured Data Management Will Improve Your Analytics
Despite the challenges inherent in managing unstructured data, the positive impact a solid strategy will have on the quality of your analytics—and, by extension, your business outcomes—makes the investment worthwhile.
At the highest level, an effective unstructured data management strategy provides all users, not just data scientists, with a comprehensive data story that can be used to drive decision-making throughout the enterprise.
When managed well, unstructured data adds flexibility to the types of insights that can be gathered from the data because it isn’t constrained by a fixed schema. This also makes it easier to collect, distill, and correlate information from heterogeneous sources.
From a practical standpoint, unstructured data management makes data portable and scalable throughout the organization so users can confidently take action on relevant insights, from enabling predictive analytics to improving operational decision-making to increasing marketing intelligence.
What’s Next for Unstructured Data Management?
As rapid technology adoption continues to define and shape the enterprise business landscape, many organizations are looking for ways to manage high volumes of unstructured data efficiently and profitably.
Virtualitics AI Platform leads the industry in AI-based data analytics and multi-dimensional visualizations to empower organizations in every industry to take control of their complex data management and put that data to work for them.
Don’t waste more effort trying to decipher your unstructured data. Contact Virtualitics to request a demo of Virtualitics AI Platform.
Data can be a powerful tool in any industry. It enables companies to understand the past and predict what might occur in the future. Predictive analytics attempts to answer the question, what will happen next? It uses modeling and forecasting to make those predictions with high probability. Its use in healthcare is wide-ranging, and one of the most important areas it can impact is personalization of healthcare for better outcomes.
The Role of Predictive Analytics in Healthcare
Predictive analytics leverages AI and machine learning to analyze historical data and identify patterns. Next, predictive algorithms and training models evaluate data across multiple sources. That data can derive from electronic health records (EHRs), administrative channels, health surveys, claims databases, medical alert services, patient registries, patient-generated from devices, and disease registries.
That’s a substantial amount of data, and it is continually growing. One patient can generate 80 megabytes of data each year. However, the volume is only one obstacle. Healthcare data lives in silos, and there are many issues regarding data sharing. Healthcare organizations need a platform to aggregate data and create data visualizations so that insights are actionable. Attaining this can reduce healthcare costs, improve patient care, and forecast outcomes (e.g., risk of disease or complications).
Predictive Analytics Is Revolutionizing Personalized Care
Every person is unique, regardless of whether or not they suffer from the same diseases or ailments. Diagnosis, prognosis, and treatment all look different depending on the specific patient. There are many standards around these components of care, but the more personalized they can be, the greater the likelihood of positive outcomes.
Here’s how each segment can benefit from predictive analytics.
Using Predictive Analytics in Healthcare Diagnosis
Predictive analytics can determine a patient’s likelihood of cancer or other diseases. If patients receive an early diagnosis, they can begin care faster, which improves their survival chances.
Using Predictive Analytics in Patient Prognosis
Clinicians can apply predictive analytics to determine if recurrence of disease or readmission after a hospital stay is likely. With this prediction, proactive intervention can occur.
All organizations want to prevent hospital readmission. It has a negative impact on many operational areas and patients. Predictive data analytics can combine data from various sources to identify those patients who might have complications when they return home. The data would look at patient risk factors, including social determinants of health (SDOH), to identify those with a high probability of complications. If that’s the case, providers can coordinate a care plan to prevent readmission.
An example is researchers using physiological data from the hospital stays of patients with congestive heart failure. They looked at data from 10,000 patients, determining that it could predict medically adverse events like readmissions.
Using Predictive Analytics to Determine Treatment Options
Not every patient will react the same way to treatment. The application of machine learning-based predictive analytic models can support treatment for patients with acute and chronic diseases.
In more immediacy, predictive analytics can provide insights to physicians at the time of care with real-time clinical decision-making support.
Regarding medication, precision medicine and genomics are becoming more critical. Predictive analytics modeling and simulating inform clinical trials to optimize dosing, predict product safety, and identify possible side effects. Biotech firm Isoplexis uses predictive analytics to connect the mechanisms and outcomes of therapies and disease.
More Ways Predictive Analytics Can Support Personalized Care
In addition to diagnosis, prognosis, and treatment, predictive analytics can also model hospital staffing needs and the availability of critical care beds in a proactive approach. It can also track hospital-acquired infection rates, which is critical in mitigating spread. Finally, it can also work to predict the maintenance of equipment to prevent failures.
Challenges of Predictive Analytics in Healthcare
Healthcare data is different from any other category. Regulations, including HIPAA, define the parameters around security and privacy. That can often be a barrier to greater data access.
Another primary challenge is the lack of expertise and technology. Healthcare analysts need advanced platforms to operationalize their processes. Without buy-in from leadership, they won’t receive the funding they need for people and technology.
Finally, healthcare data suffers from poor quality. There are no standardizations across EHRs or databases. The data may also be inaccurate and full of duplicates. Without proper data hygiene, it’s hard to get meaningful results.
Solving Some of the Challenges of Predictive Analytics for Better Patient Care
Our AI-driven data analytics and 3D visualization platform can’t resolve all the challenges of healthcare data. It can support the healthcare industry by making predictive analytics accessible that doesn’t require data scientists to uncover insights and make accurate predictions.
Getting people and goods from one point to another is fundamental in the world economy. Improving transportation has never been more important in today’s climate, and many are turning to predictive analysis. The desire to adopt this approach is sound in its possibilities, but it’s not an easy road. Multiple factors are making this an arduous task for organizations.
What’s Driving the Demand for Predictive Analysis in the Transportation Industry?
One of the most significant drivers is the demand for e-commerce deliveries. For example, FedEx has handled more than 12 million packages a day in 2021, which represents a significant increase over 2020. The increase in online orders has also led to an increase in subsequent returns.
With demand high, there are other considerations, such as a lack of drivers and operators. Supply chain woes continue, and transportation is often the weak link, especially in last-mile deliveries. Customers have elevated their expectations about deliveries and aren’t as forgiving as they used to be.
Logistics companies are striving for digital transformation by using data to make better decisions. That data, however, comes from disparate systems, making its analysis difficult.
With all these competing and intersecting challenges, employing predictive analytics in a strategic, accessible way is promising.
Let’s look at specific ways predictive analytics can help the transportation industry adapt to new market pressures and digitization.
How Predictive Analysis Supports Transportation
Here are 10 ways you can leverage predictive analysis in the industry.
1. Adjust shipment patterns
When you have data on the entire shipment process, you can use that data to improve the process. Although there are many parts to a shipment’s journey, it’s no longer a mystery where the challenges are, whether they’re at the beginning or the end.
You can use this data to adjust your shipping patterns when you discover the culprits of delays.
2. Provide on-time deliveries through the most efficient routes possible
Efficient route planning could be vital in increasing your on-time deliveries. The best way to achieve this is to apply Internet of Things (IoT) sensors to vehicles and shipping containers. These sensors ingest a lot of data that can lead to optimized routes.
3. Reduce the risks of cargo inventory errors and miscalculations
Reliable predictive analytics reporting can prevent calculation errors regarding inventory. With this capability, once data indicates there are cargo errors, you have the information necessary to intervene immediately.
4. Predict disruptions before they happen
Foresight is something every business would like to have. Predictive analysis makes that possible. Many disruptions can impact your shipping operations. Some of those disruptions are more predictable than others. Using sensors and historical data, you may be able to foresee things that could jeopardize logistics, including traffic issues, supply chain problems, and fleet management issues.
5. Create visibility into seasonal buying patterns and forecasts
Certain times of the year will have higher levels of demand, such as the holiday season. Transportation companies are aware that this uptick will happen, but they may not have clarity on the details.
Visibility requires looking inside the data, and a 3D visualization is one of the best ways to do that. Companies can look at historical data and manipulate their models with different variables, ensuring they create data-driven forecasts to plan for the increasing demand.
6. Practice proactive fleet maintenance
Taking care of your fleet is essential to keeping things moving. When breakdowns occur, you lose valuable time. By collecting data from your fleet and analyzing it via sensors, you can move to a proactive approach to maintenance, which reduces unplanned downtime.
It can also reduce overall maintenance costs each year. Identifying potential issues before they arise is key to achieving this.
7. Increase warehouse efficiencies
Being more efficient in the warehouse means you can be more efficient when you’re on the road, on the rail, in the air, or at sea. A well-run, organized, and data-driven warehouse uses IoT sensors to find inefficiencies.
8. Manage fuel efficiency
Those IoT sensors used for route efficiency and predictive maintenance can also help with fuel efficiency. First, maintained vehicles tend to get better gas mileage. Additionally, if routes have a better flow and idle time is decreased, they’ll use less fuel.
Fuel also fluctuates in pricing based on a variety of factors. Analyzing these factors could help you allocate fuel more efficiently.
9. Optimize and reduce costs
Whenever you use data to make better decisions on routes, maintenance, and forecasting, you’re going to reduce costs associated with every aspect of transportation.
Through a continued analysis, you’ll be able to identify cost drivers and possible actions you can take to reduce their impact.
10. Address last-mile delivery challenges
The last-mile delivery problem is growing, and it currently comprises about 53 percent of overall shipping costs. You can look forward by analyzing historical data around this part of the delivery process. You can find recurring patterns through data visualizations that help you predict what routes will be like in the future.
Using the data, you may be able to optimize everything from routing to timing based on traffic patterns, or where to plan your next warehouse to improve proximity.