Organizations are striving to make data-driven decisions that will keep them ahead of the competition and position themselves for strong, healthy growth. They have vast amounts of data at their disposal that potentially hold the answers; they’re missing enough data science skill to extract those answers. The key to closing that gap is in the untapped potential of the data analysts. With the right tools and techniques, upskilled analysts can supercharge an organization’s entire data strategy.
The Skill Shortage
According to a survey by PwC, “85% of business leaders agree that companies need to upskill their workforce significantly to meet the challenges of the digital age.” The rate of change and a high degree of competition means that to get an advantage you need to stay ahead. Pivot faster and pivot sooner, because success is a matter of degrees.
I spoke at the Gartner Data and Analytics Summit, along with Virtualitics Head of Product Bryan Katis, about how Intelligent Exploration is the superpower analysts need to help them surface the answers that are hiding in your data and provide the insight that will drive successful strategies.
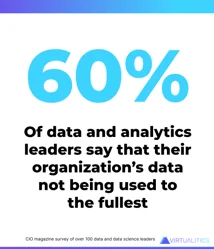
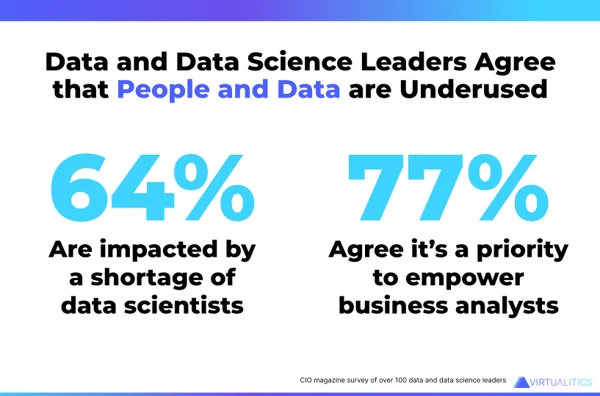
We surveyed data and data science leaders early this year and asked them how their teams could be more effective. They agreed that there’s not enough data science talent and that the lack of resources is holding back their exploration and overall AI strategy. They acknowledged that the data they’re putting so much effort and money into capturing, storing, and organizing isn’t being used effectively.
The way to overcome the strain on your data science team and get more out of your data is to upskill your data analysts. These leaders agreed that it’s a priority to empower their business analysts with more data science capabilities so that they can contribute more to the overall data strategy.
Upskilling Data Analysts with Intelligent Exploration
Intelligent Exploration–AI-generated and AI-guided exploration of complex data–is the ideal way to put some of that data science power into the hands of business analysts.
According to Gartner, most organizations have found ways to derive intelligence from big data, but many struggle to manage and analyze a diverse and broad set of data at scale. Those same massive data sets that hold the answers can also prove too unwieldy to analyze as-is. Analysis requires a data sample.
Some platforms employ a sampling solution behind the scenes, but these are usually quick and dirty shortcuts that just grab a handful of rows (such as the first and last few thousand rows.) The analyst doesn’t know the quality of the sample and maybe wouldn’t even have the skill to generate a better, more representative sample. They certainly aren’t able to detect the anomalies in the entire dataset to ensure that they were accounted for properly.

This is something even seasoned data scientists struggled with. In a recent poll, we conducted with data science communities on LinkedIn and we found that most use random sampling (though not all) and many identified challenges they’d encountered.
So, as part of empowering the analyst we wanted to make sure that they could generate a proper random sample, from a massive dataset on their own, specifying the size, rows, and columns needed. To do this we introduced Smart Sampling, a collection of AI-powered apps that enable the user to filter, detect anomalies, and sample data directly from massive datasets.
Enhancing the Capacity to Explore
Another way that Intelligent Exploration levels up analysts is by putting advanced data science techniques into the hands of more users. Limiting the data analyst to descriptive and diagnostic analytics, which are mainstream but only surface-level, keeps them from really getting into the complexity of business problems.
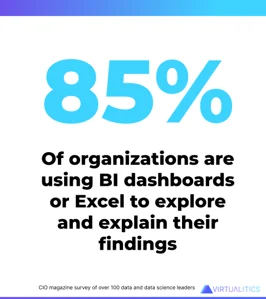
We hear from analysts who suspect problems they can’t prove because they don’t have the skills or tools to tease apart the data and their data science teams are too consumed elsewhere to follow up on their hunches. The analysts have good instincts, but the traditional BI tools they’re using really struggle to uncover and portray complex, multifaceted relationships in datasets. If you’re talking about a problem that has more than a couple of drivers, trying to rank those features and illustrate their interplay on a 2D dashboard is incredibly limiting. Our survey found that 85% of organizations were using Excel and basic BI tools for analysis, and they’re simply not suited to exploring complex data.
Virtualitics’ Intelligent Exploration gives a huge assist to analysts through embedded AI routines that perform complex analyses and display the results in rich and clear 3D visuals. Our platform suggests multiple ways of looking at the data, prompting analysts of all skill levels to explore from different perspectives. AI-discovered insights draw the analyst’s attention to critical information, rather than relying on them to notice for themselves.
Network extraction is a perfect example of an analytic technique that is currently heavily limited by skill and toolset access, yet the potential insight is enormous—from customer segmentation, to trade routes, to equipment dependency. Our patented Network Extractor makes this technique available to analysts and our AI naturally guides them to the insights within.
Our visualizations are also beyond what an analyst typically experiences in a dashboard. A picture is worth a thousand words, and your data visualizations need to capture the complex relationships in your data. Studies have repeatedly shown that we process information better in 3D, and that extends to analyses. Just make sure that the tool you select isn’t using forced perspective 3D, which too often obscures details and doesn’t allow the user to rotate, expand and click into insight. Our true 3D visuals are ready to be explored by your data analyst and business teams alike.
A valuable part of the data science strategy
Empowering analysts to do rich exploration on their own expands their impact on their team but it also increases their value to the data science teams. Your analysts are closely tied to the business and are in a great position to do the foundational work to uncover and refine possible use cases for data-based strategies such as AI.
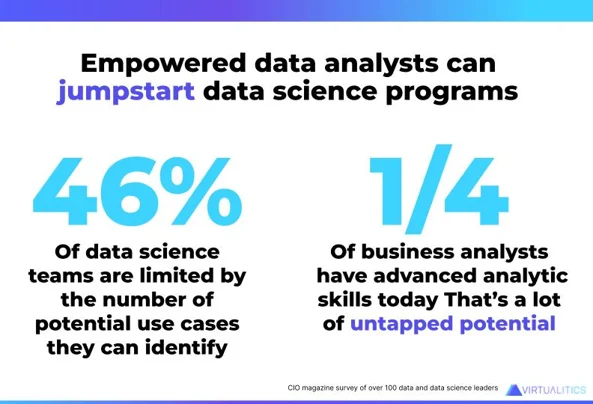
Our survey of data science leaders revealed that almost half of them felt that their AI functions were limited by the number of use cases their teams could identify. They also reported that only a quarter of their analysts have advanced skills, suggesting that there is a huge amount of untapped potential in the analyst community that will unstick not only the analysis being done within the business functions but also the data science strategy overall. When data analysts can derive deeper insights from the business data, they are also positioned to spot potential AI use cases and do a preliminary assessment of feasibility.
Reaching Goals with Data Analytics
The goal of any data analysis function is to find that deep insight that will shape and inform business strategy for the better. We’ve gotten used to dashboards that show a lot and tell us very little. The empowered analyst has the potential to turn this equation on its head and focus on discovering the big impact meaning from across vast datasets and delivering it succinctly.
Empowering analysts to explore complex problems and all of the data that ties into them will provide greater value to the business, and also to the data science teams. Their discoveries could prove to be the catalyst for transformative strategic discussions, the foundation for new and improved reports, or even the beginnings of the next AI use case.
Upskilling analysts will add value and capacity across your organization, from initiatives that start and stay within the business to laying the foundation for data-driven strategies like AI that transition to the data science teams. Download our free e-book to learn more about Intelligent Exploration, or set up a 1:1 demonstration to see how Virtualitics can upskill your analysts.


