Multitasking? Great! You can listen to this blog post by clicking above or find our podcast, Intelligent Data Exploration, on major podcast platforms.
Sometimes when you’re managing things—parts, people, processes, and logistics—it can feel like you’re always reacting to something. While the world aspires to predict everything from the weather to when we need to change the oil in our vehicles, we can’t always know when a part will fail, someone will call in sick, or a supply chain will hit a snag.
We try to anticipate what we can, based on experience. Then we’re forced to react to everything else because predicting lead time, appropriate inventory, and time to repair is incredibly complex with many variables in play. Somewhere, in all that data that you’re capturing about your operations, the information you need is hidden. But the challenge lies in connecting those dots and pulling out the insight you need to build an AI model and put predictive maintenance workflows in place.
Analyzing maintenance and supply data with Virtualitics
Maintenance operations create and collect a lot of information—parts inventory lists, staffing plans, procedures, repair times, repair logs, shift planning, and so much more. But often these items are only part of record keeping, not used as a resource for data exploration to predict failures and improve outcomes because finding the insight in a dataset as vast and varied as this is a challenge.
Traditional BI tools would require an incredible number of two-dimensional graphs to illustrate the data, and those graphs wouldn’t be able to express the connections between so many variables. And the data in the rich text documents is often left completely untapped.
But by applying out-of-the-box AI (Intelligent Exploration) to evaluate historical maintenance data across data sets and data types, Virtualitics enabled data scientists to quickly determine certain components’ Mean Time to Failure (MTTF) and what factors contribute to that failure. Because Virtualitics’ Intelligent Exploration can analyze an unlimited number of attributes at once, you can throw in every possible contributing factor and it can quickly zero in on the drivers of product failure.
While predictive information like MTTF is insightful, that data alone is just part of the answer. The connections between key drivers like failure data and your maintenance and logistics activities like time to repair and inventory optimization are the places where you’re able to implement strategic practices that will positively impact your readiness rate.
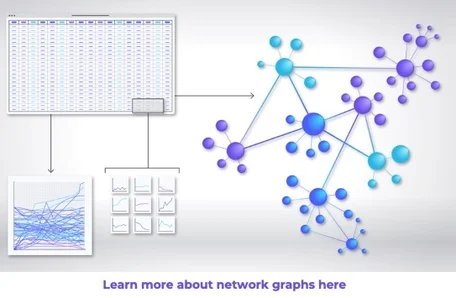
Intelligent Exploration allows teams to understand supply chain constraints in the context of failure rates and availability in order to better support maintenance actions. With network graphs and AI-guided insights, supply managers, schedulers, and maintenance managers can work together with the data science teams to understand how to proactively balance inventory availability with budget and manpower.
Working as a team with a clear understanding of the drivers in all of their data, they can evaluate demand signals to determine the best ways to optimize all their resources. Virtualitics algorithms can also identify outliers in data, allowing teams to consider edge cases and how they might accommodate sudden needs.
With all of this insight, the data science team can build an AI model that can predict when certain components will fail with a high degree of confidence in time for the logistics teams to plan accordingly. Virtualitics Intelligent Exploration helps to unearth the critical data that should inform an accurate predictive model that allows maintenance leadership to determine how to become less reactive and more proactive.
Explainable AI to guide process optimization
Creating a usable, valuable predictive model for preventative maintenance is a challenge that Virtualitics solves, but the other piece of the puzzle is ensuring that the end users understand and trust it enough to use it. Because the users aren’t analysts– they’re people like me whose main job was to maintain equipment and keep things moving.
I was the lead maintenance manager for an aircraft maintenance unit, responsible for balancing aircraft maintenance and flying requirements for my respective unit. Shortly after I started the position, an increase in COVID cases drove a change in protocol in order to keep our personnel safe which drastically reduced how many personnel I had available to commit to fixing airplanes. During COVID my maintenance capability varied from week to week and many times from day to day. Managing it all was a constant effort.
A platform like Virtualitics could have given me a deeper understanding of my resources and availability, so I could better assess our maintenance capability. Predictive workflows delivered via the Virtualitics AI Platform provides recommendations for actions teams can take to improve processes, backed by clear explanations of the reasons behind them. That would’ve been a huge help to me, and I’m very happy that we can provide that resource to our customers.
Collaborating for Data-driven Optimizations
If your team is ready to move toward model-based optimization, it’s Intelligent Exploration that ensures that your model will be based on the right drivers and actions and provide value to your organization. And with explainable AI powering the dashboards and workflows, you can trust that your intended audience is able to quickly identify their current status, see potential roadblocks, and plan for the optimal use of their resources.
Transition from reacting to unscheduled maintenance events to proactively scheduling assets and manpower for repair. Virtualitics’ takes a holistic view of the maintenance effort in order to make data actionable.
Multitasking? Great! You can listen to this blog post by clicking above or find our podcast, Intelligent Data Exploration, on major podcast platforms.
Our mission at Virtualitics is to help teams explore and experience their data without limits so that they can find the insights that will change their business. And as the chief technology officer, I oversee the development of new technologies that will deliver on this mission for customers. We’re always looking to solve these complex data challenges in ways the industry hasn’t attempted. That’s why I am proud to share that Virtualitics was awarded its fourth U.S. Patent for Systems And Methods For High-Dimensional 3D Data Visualization.
Virtualitics was started because my co-founders and I saw that the promise of AI was being held back by the tools being used to explore and understand the data. We designed the Virtualitics AI Platform to explore complex data sets for the purpose of creating and deploying business-changing AI workflows. We believe that good AI applications need to be based on a thorough exploration of all the relevant data to ensure responsible, impactful AI and so we built AI into our platform to power what we call Intelligent Exploration.
Intelligent Exploration uses AI to explore, visualize, and interrogate data, allowing data scientists and analysts to build models on a solid foundation. The innovative features that we build into our platform to support this work are so unique and progressive that Virtualitics has been awarded four U.S. Patents.
Intentionally Innovative
One of the things I’m most proud of as Virtualitics CTO is making innovation a core part of our development cycle. My team and I are always looking at how we can move the practice of advanced analytics and AI forward through the capabilities of our platform. As we start to build out our solutions, we also assess our work to identify what is 100% new to the market (in the context of patents, this is called being novel and is a requirement for being granted a patent.)
It can be difficult to articulate how software offers unique value. Often things are “better” or “faster”, but rarely new and different, addressing new, or underserved challenges. Quantifying innovation and new ideas is a challenge. Our patents protect our intellectual property, but they also illustrate that our technological advances and capabilities are unparalleled.
Intentionally bringing innovation into our process has served us well; with five patents, we’ve made outstanding progress as a fairly young company.
Our Patents
Our patent portfolio continues to grow alongside our technology, building upon each other as our technology advances. Our combined patents represent the most innovative and impactful parts of our platform in four main areas of AI and data analytics: 3D visualization scalability, creating a fully collaborative platform, AI-guided exploration, and network graphs.
3D Visualization and Scalability
The amount of data organizations are gathering is growing exponentially–it’s now much greater than traditional, 2D Business Intelligence tools can thoroughly explore. As a result, data scientists and analysts either get bogged down trying to assess everything with old techniques or scale back their exploration. Both introduce risk into their projects. Effective AI should be based on the thorough exploration of all the relevant data to discover the meaningful drivers, the best targets, and to properly assess the quality of the data to mitigate risk.
From our earlier research at Caltech, we knew that this kind of exploration of complex data sets was best done with 3D visualizations. Multidimensional visualizations can show more complex analyses and enable the user to look at them from different angles, facilitating discovery. We wanted the user to be able to generate powerful visualizations quickly and pivot them, drill into them, and replot them seamlessly, so that the focus was on finding insight, not waiting for the image to reload.
To provide this experience, we developed specialized data structures to optimize the handling of large data sets for processing on GPU. This method allows us to render and interact with high volumes of multidimensional data points in 3D and immersive environments. Our approach enables browsing data at a high frame rate, and users are able to seamlessly interact with them in a native 3D environment, whether it’s on a screen or through VR.
Collaboration
Collaboration is a huge part of any successful AI or data-driven strategy. Whether it’s working with fellow data scientists or analysts, subject matter experts who can add critical context, or bringing stakeholders up to speed, collaboration is key.
We developed a collaborative framework called Shared Virtual Office that allows multiple users to collaborate using our 3D visualizations and embedded AI in real time. The Shared Virtual Office is available through both our desktop environment as well as in VR, or both during the same session!
Network Graphs
Graph analytics has existed for a while now, but the complicated technology stacks and data science required to create them has kept adoption low. Moreover, the resulting 2D visualizations usually fail to accurately communicate the relationships captured, and take a long time to render. Flattening a visualization that uses proximity between elements to denote relationship status can’t properly capture those relationships.
But we knew that network graphs needed to be a key tool for any data scientist or analyst who wanted to discover the relationships and dependencies in their data sets. Data-rich network graphs enable teams to identify root causes, manage risks, and make impactful decisions based on the communities and behaviors they discover. We needed to make them accessible.
We developed a no-code AI algorithm that extracts relationships from tabular data sets and generates a 3D visualization of that network graph. We are the only platform with a network extractor, and ours is designed so that both categorical and numerical values inform the relationships. We also created a GPU-accelerated 3D force-based graph visualization algorithm with AI-enhanced initialization to ensure peak performance of the graphs as they are generated and as users interact with them (up to 100X faster performance over open-source and other solutions)
AI-Guided Exploration
Finally, we wanted to ensure that complex data was explored thoroughly. Exploring complex datasets can be time-consuming, requiring specialized skills and experience. And even when you have all of those things, it can still be possible to miss critical insight if you don’t know where to look for it.
Our AI routines automatically calculate ranking metrics for data features in any given data set and generates the right multi-dimensional visualizations to illustrate the most important findings. What this means is that an analyst or data scientist can access a large dataset containing thousands of features—for example, a rich dataset of buyer behavior, or every scrap of data about mission-critical machinery—and simply ask questions about what’s driving one of those features such as “What’s driving amount spent?” or “What drives unscheduled maintenance?”.
The AI combs through all of the data attributes in the set to find the drivers, rank them, and generate multidimensional visualizations such as scatter plots, histograms, time series, or geospatial plots, based on the main drivers found. Depending on the characteristics of the features, our proprietary method assigns the various dimensions we support to the most ideal and substantial 3D visuals to enhance understanding. For example, on the axis, a specific color, scaled size, identifying shape, halos, or shown over time–our Intelligent Exploration selects the one that shows off the insight best.
But we didn’t stop there. We also enhanced the AI routines with AI-generated Insight that calls out statistically significant insights, making expected impacts and potential biases clearly visible to all users regardless of their data literacy. This feature ensures that user attention is drawn to what matters and that their conclusions are more trusted and reliable, helping ensure your AI program stays compliant and responsible. Explainable AI (XAI) is a must-have to ensure trust and adoption of advanced data analytics and Machine Learning.
Future Innovations at Virtualitics
Each of these innovations work together as part of the Virtualitics AI Platform to provide unlimited data exploration, engaging multidimensional visuals, and a collaborative space where data scientists, analysts, and business leaders can strategize together. Learn more about the Virtualitics AI Platform and how we’re combining these patented tools into an industry-leading product here.
The innovation cycle at Virtualitics continues with several more patents at various stages of the process. We are passionate about the advances our team is making, and we look forward to seeing how teams put the Virtualitics AI Platform to work.
One of the biggest frustrations in business today is that companies are not getting enough value from all the data they’ve been collecting and storing. Leaders know the answers they want are splashing around in that big lake of data: the right pricing structure, a smoother-running supply chain, service experiences that make people lifelong customers.
But the struggles are real. Businesses don’t know where to begin looking for insight. They fear they might perpetuate bias within their AI models. Jargon and visualizations are so complex it’s hard to see what’s really going on.
Enter a new integration that solves these problems: The Virtualitics AI Platform helps teams make better use of what’s in a data lake. You can explore your data using AI to do the legwork, drop yourself into a visual story in a matter of seconds, get AI-generated recommendations in simple terms, and take action, in one platform. Here’s a rundown.
How the Virtualitics and Databricks integration works
The thousands of companies that rely on Databricks’ Lakehouse Platform to unify their data and produce usable analytics and AI can:
- Easily and securely connect to data in Databricks Delta directly from the Virtualitics AI Platform. Data stays securely where it resides.
- Accelerate discovery using AI. Our 3D, multivariable, AI-guided visualizations find and illuminate data relationships in complex relationships–up to two 12 dimensions!–in ways that 2D visualizations can’t.
- Transform tabular data into network graphs. In just a few clicks you can transform tabular data into intuitive, meaningful, and interactive 3D network graphs, without having to do a lot of formatting.
And you can facilitate all of this while keeping access to your data secure and without having to manage a bunch of credentials. After your administrator sets up a Databricks cluster for use in Virtualitics, your team of data scientists, analysts, and business users can access the configured data cluster from Virtualitics. Data remains secure without slowing anyone down.
Bring the power of advanced analytics within reach of more people
Databricks users can benefit from Virtualitics’ multi-user interface because it can enable hundreds more people across the business to get value from complex datasets, instead of a small team of expert data scientists. Analysts and citizen data scientists can do self-serve data exploration by querying large datasets with the ease of typing in question and AI-guided exploration instead of writing lines of code. Business decision makers get their hands on AI-generated insights that can help them take smart, predictive actions.
And your scarce data science resources can stay focused on complex data analysis and building the right machine learning models, (informed by insights and direction from the data).
Take the example of a financial services company that wants to comply with international sanctions against Russian companies and individuals. There are over 10,000 sanctions in place with more being added. Uncovering hidden financial relationships is a perfect job for AI-generated visualization.
A company could start with a database of taxpayer ID numbers, then layer on tabulated lists of registered limited liability corporations (LLCs), a common structure for shell companies in the US. The user could then look for transactions between sanctioned taxpayer entities and other entities that share common information, like email addresses, addresses, and more. Connections that were hidden become visible, automatically surfaced by our network extractor or smart mapping technology (and the best thing is, Virtualitics is smart enough to know which technique to use for the data provided and the query made).
Insights and accurate predictions, faster
Another benefit of using Virtualitics through Databricks Connect is that our platform tells you where to focus, where the gaps in your data are, and what’s important. It does this in seconds and follows-through with plain English explanations.
Less technical users and new users can perform sophisticated analyses without having to know data science terminology. Virtualitics’ Natural Language Query Assistant lets you use simple commands like “What relationships exist between my products?” If you’re not sure what to ask, the system provides Suggested Queries. In our Russian sanctions example, for instance, anyone could type in a query like “Find anomalous transactions” and see which factors are most likely to drive questionable transactions and specifically which records were anomalous.
As the number of variables you need to consider increases, the number of 2D plots you need to consider becomes overwhelming and tedious. This is where our AI can help to find the right combination of variables to use and just show one rich and meaningful data visualization. Smart mapping, another powerful AI-driven visualization routine in our platform, helps you instantly understand the key driving features in data. It’s especially handy at uncovering hidden relationships within your data when you’re working with a large number of features, by automatically generating several AI-suggested visualizations for you to interpret the results.
For example, you can discover that Variance and Region are the largest driving factors for returns over a three-year period in an Exchange Traded Fund (ETF) dataset.
When it comes time for recommendations, explainability is baked in, with users seeing the context for the prescriptions generated. Virtualitics provides both direction and the “why” behind recommendations. Then we go to the next step, closing the gap between prescription and decision, by embedding the point of action right in the dashboard.
Turn complex data sets into 3D visualizations—without coding
There’s a network of relationships hidden in your spreadsheets or tabulated data that you may not have the right tool to see. Virtualitics’ patented technology can extract hidden networks (network graphs) and show them as 3D data visualizations, whether your data is numerical, categorical, or unstructured. This process is automated, without requiring lots of math, specially coded files, or additional visualization apps.
Here’s how this works without our technology: Traditional data visualization tools require a properly formatted file. Meaning that you have to carefully analyze your data before it’s turned into a visual product. In fact, in many cases you would need to be an expert at creating knowledge graphs, graph theory, and writing code to be able to create that file. Plus, the visual that is typically produced from the formatted file is a 2D plot, with data points trampling over each other with no obvious means to segment it out.
Specifically, our network visualizations show communities of interconnected points extracted from your tabular dataset by our AI. The relationships are automatically extracted and rendered in interactive 3D visual while providing clear explanations for how the communities of points were formed. For example, you can explore commonalities among pre-approved credit card prospects, you can discover the attributes that define an optimized customer segmentation, determine common behaviors in troll factories distorting the narratives on social media, and so on. Virtualitics’ network visualizations can help you boil down millions of records into a handful of easy to grasp relationships, processes, and insights that you will miss with traditional BI tools. These AI-guided explorations help surface biases or unintentional artifacts in your data that become apparent when viewing data the way a predictive model does.
Another benefit of Virtualitics is the ability to render such graphs 100X faster than other graphing tools. Other software solutions’ capabilities end with the visualization: they don’t offer other tools or AI routines, explanations, or story-telling capabilities that you need to get your data to work for you.
Businesses get more value from data with Virtualitics and Databricks
For companies using Databricks, Virtualitics helps deliver more value from data by bridging the gap between data science and business action. For citizen data scientists and data analysts, Virtualitics makes it easy to explore complex data and generate the insights that matter to a business. For data scientists, Virtualitics can revolutionize the critical story-telling and model delivery segments of the AI lifecycle and get more value from their Databricks clusters. Look for a more technical how-to on this integration in a coming post.
To get started and see a demo, contact us.
When my co-founders, Ciro Donalek, Prof. George Djorgovski and Scott Davidoff, and I founded Virtualitics in 2016 after 10 years of research done at Caltech, we did so with the ultimate vision of helping people better understand and drive value from their complex data.
We knew that making advanced analytics more accessible and easier to understand would lead to better AI, better decision making, and ultimately help people solve the previously unsolvable.
Over the past six years, we have seen Virtualitics transform how companies make decisions, whether it be supporting predictive maintenance for the US Air Force, enabling researchers to speed up the pace of drug discovery, or helping financial institutions more efficiently manage risk.
While it’s incredibly rewarding to see Virtualitics being used by companies today, what’s even more inspiring is the potential of how it will be used in the future. That’s why it was incredibly exciting to learn that Virtualitics was Recognized by Gartner, the world’s leading research firm, as a 2022 Cool Vendor for Analytics and Data Science (I may have let out a ‘whoop’ when I got the news.) To be included in this report is no small accomplishment. It means that your company is anticipating where the market is heading and delivering a solution that drives real business value.
Why cool?
Virtualitics was one of only three companies selected for this year’s Gartner® Cool Vendors in Analytics and Data Science. Here are a few of our capabilities Gartner® singles out:
- An immersive platform that brings a bit of the experience of real-time gaming to analytics. Like a shared virtual reality (VR) office where users can stand inside of and touch a dataset.
- Ability to combine up to ten dimensions of data versus two, and deliver complex analyses of them in visually compelling ways.
- A workflow experience that moves users seamlessly from discovery to analysis to action. Teams can collaborate from anywhere, including mobile devices, visualize what lots of complex data is saying, then act on it, right in the dashboard.
- No coding skills required.
Closing the Gap between Data Science and the Business
All of these capabilities are in support of our larger mission, closing the gap between data science and the business. At every step of the analytics process, from preprocessing, to data exploration, to AI predictive models Virtualitics enhances the user’s ability to understand what is happening. Whether the user is a data scientist, data analyst, citizen data scientist, or a business stakeholder we ensure that the insights are pulled forward for you to see, touch, and explore.
Realizing the Potential of AI
Why does closing the gap matter so much? Because for organizations to realize the potential of AI and scale it across their enterprise in the form of AI applications that inform decisions and direct actions, it first needs to be the right application and the right AI model. That means that the investigation needs to include the business so that they can provide background and expertise, and identify where AI can be best leveraged. And it means that the exploration underlying the AI model needs to be comprehensive–something that can often take months using traditional methods.
It also means building trust with the users who are expected to act on the AI models. The last mile of AI delivery is the hardest to bridge, and we’re gratified that Gartner has acknowledged that we’ve done it.
If you’re interested in reading more, you can download the full Gartner 2022 Cool Vendors in Analytics and Data Science here.
Transformative Features to Improve User Experience, and Explore Complex Data.
We recently announced the new Virtualitics AI Platform and today we are sharing some of the game-changing features that are included in this first release of our unified platform. These new features support our mission of helping business leaders make impactful data-driven decisions using the power of AI in a way that is both easy to access and understand.
This release is full of transformative features that improve the user experience and make it even easier for citizen data scientists and business leaders to explore, understand, and make predictions from their complex data. (Plus, we’ve made a huge upgrade to our look and feel).
Bridge the Gap: Data Scientists, Data Engineers, and Business leaders
Virtualitics now allows for different permissions and experiences for your team based on their job function or needs. Whether you’re a data scientist who wants to share insights or analyze data, a business leader that needs to quickly run a predictive workflow, or a cloud engineer that is looking to host a data pipeline in a secure environment, Virtualitics allows you to get what you need, quickly.
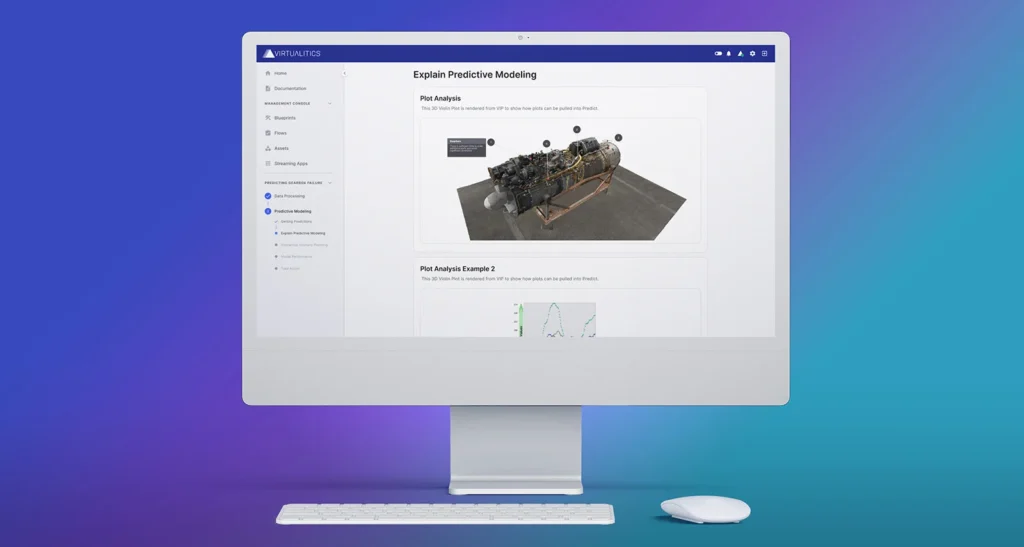
Understand Your AI Predictions with Visualizations
Using the Virtualitics Explore capabilities, business leaders and citizen data scientists can dive into data visualizations to see and understand the relationships and key drivers between the data and the AI prediction. This is a new level of explainability that connects the dots between data science and business outcomes by allowing the subject matter experts to be full participants in identifying, and putting into practice, AI workflows.
Interact with AI Predictions and Create ‘What If’ Scenarios
Now non-technical users and citizen data scientists can easily test different scenarios by manipulating input values to generate predictive insights in seconds. Within the Virtualitics AI Platform, insights and explanations are generated and presented in a way that is highly interpretable and shareable across stakeholders.
Identify Hidden Relationships in Numerical Data
Identify potential fraud faster or identify communities that you couldn’t see before. With the new Numerical Network Extractor (NNE), you can transform a tabular numerical dataset into meaningful categories and create a network from it – highlighting previously unknown or difficult to identify relationships in the data – in a matter of minutes! For example, with wage inflation, commonly used income ranges may no longer provide meaning–our Numerical Network Extractor will identify and create ranges that are relevant to the communities you’re working with.
Trust Predictions with Enhancements to Explainable AI
We are introducing a new method for Explainable AI (XAI), that supports automated natural language insights for network graphs and other clustering and anomaly detection methods.
Automate Manage Machine Learning Workflows
Easily deliver insights and predictions across your business by scheduling your machine learning workflows to run automatically and alerting your team when they are ready to view.
Dark Mode or Light Mode? You Decide. Plus Color Palette Updates
We’ve made light and dark themes, updated color palette across applications and a new web application for our explore mode. Our team is proud to roll out these new features and this is only the beginning.

Look for more updates from the team soon and in the meantime, let us know what you think or request a demo.
Many organizations have already been looking to AI to drive business growth and value — a McKinsey survey found that 63% of respondents report revenue increases from AI adoption within their company. And AI’s role is only going to become more important. In fact, it’s estimated that AI will contribute nearly $16 trillion to the global economy by 2030.
However, even though businesses recognize the importance of AI, they still have trouble implementing it. Half of all AI projects fail, and of the companies that successfully launch projects, very few of them are scaling AI across the entire organization. This happens due to several reasons: a lack of trust between the business and data science teams; AI being used in one-off tests that are cut off from the business; and not enough data scientists to meet growing demand, resulting in a lack of time to develop effective AI models (and communicate these to the rest of the company).
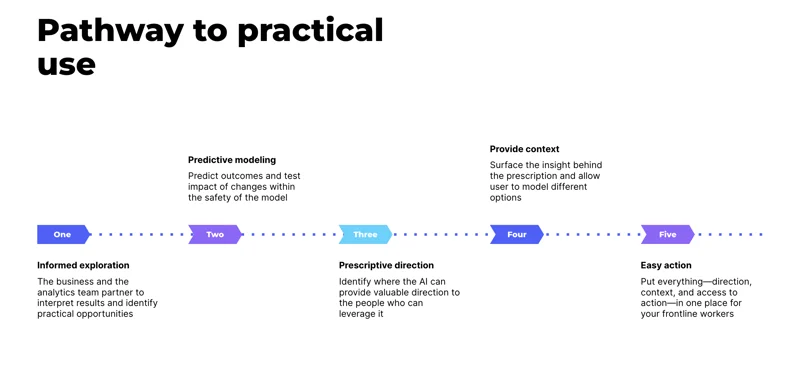
In our recent webinar I sat down with Manny Sevillano, the Head of Product at Virtualitics, and Aakash Indurkhya, the Co-Head of AI at Virtualitics, to tackle these challenges head-on and discussed best practices for addressing this AI gap between data scientists and business teams. Read on for five ways to help AI gain traction within your organization.
Find a Common Language
For data scientists, it can be easy to get hung up on optimization and improving accuracy, to the point that they lose sight of how AI is going to impact the bottom line. If your organization is too focused on the discovery and exploration aspects of AI, you run the risk of leaving important stakeholders behind. This is why a road map is crucial, and why your organization’s vision for AI has to be communicated to both data scientists and the business people.
“You need a common language for people to talk about that AI vision and the problems that they’re trying to solve,” said Aakash.
You can also achieve this by broadening the access to the tools that only data scientists typically use — giving the analysts and business people on your team access to easy-to-use AI tools can bring everyone onto the same page.
Make Engagement a Priority
Part of this disconnect between data and business teams stems from the simple fact that one team uses AI more than the other. “Practice makes perfect,” said Manny. “If you have a community that’s using AI on a daily basis, then you’re inherently building trust and confidence. If you go through enough feedback loops, you’re going to get meaningful value from something.”
Because data scientists are heavily involved in the day-to-day training and implementation of AI models, they can clearly see the value of AI within the organization. But that kind of engagement is siloed — in order to get business people on board, you also need to find ways to engage them in the process from the start, so that they also understand how AI can drive business value.
Invest in Visualization
Think about how you learn…well, anything. It’s always more effective to retain information when there’s a visual aid. “Most people are highly visual thinkers,” said Aakash. “If you can’t see what’s going on, then you have no ability to really trust it.”
To that end, visualization can go a long way in closing that gap between data scientists and business people in your organization. Visualization acts as the bridge between human and machine — especially as data gets more complex, you need something to help people understand what they’re looking at.
For example, in Virtualitics’ AI platform, one of the visualizations you can use is a network extractor, which takes a tabular dataset (e.g., CSVs) and transforms it into a 3D network. As a result, you can see natural clusters of different aspects of your data with similarities, as well as the relationships to other clusters. The interactivity of this visualization is key, too, as you can zoom in and out, click into any node, and automatically generate explanations, which helps tremendously with building understanding and engagement.
Focus on AI Exploration
In order to take your AI to successful production, you first need to focus on AI exploration. But exploration can be a sticking point in organizations because of how daunting and unguided it feels — there’s often so much data to sift through that it’s hard to know where to start. This opaqueness can lead to business teams downplaying the importance of AI or relegating it to one-off experiments that have no real business impact.
AI exploration is such a critical piece,” said Manuel. “Making that much easier and more accessible with visualization means people can actually use exploration as a tool to understand every step of the incremental AI process.”
You can think of it like going to a doctor’s office — if they try to prescribe a treatment but can’t explain why they’re doing it, then you’re not going to trust the doctor. Similarly, you’ll want to use visualization to provide much-needed context around AI exploration and help non-data teams understand how proper exploration can lead to more successful AI deployment.
Don’t Forget the Human Element
Ultimately, people are at the core of your business, and positioning AI in a way that loops them in is the most practical path to true AI adoption. You want to make sure you don’t neglect the human element in your race to deploy AI — your teams play a crucial role in double checking the AI models and providing the strategic context necessary to ensure the AI is following your business’ overarching mission.
“Humans are still the stakeholders,” said Aakash. “AI is being built to help humans, so we should be thinking of AI as the assistant.”
By making sure people play an active role in the AI processes, you can create a more effective environment for deployment. You want someone who’s consuming data from the AI to be able to provide good feedback, which allows the AI to iterate and learn, and makes it more likely to be successful.
Make Your AI Easy and Actionable
AI doesn’t have to be a black box that nobody quite trusts. By following these best practices, you can bridge the gap between your data science and business teams, making it easier to deploy AI successfully and drive impactful business value. For even more tips, be sure to watch our on-demand webinar.
Virtualitics earns Built In’s 100 Best Places To Work and top 50 Best Small Companies To Work in Los Angeles 2022.
Built In today announced that Virtualitics was honored in its 2022 Best Places To Work Awards. Specifically, the annual awards program includes companies of all sizes, from startups to those in the enterprise, and honors both remote-first employers as well as companies in the eight largest tech markets across the U.S.
“At Virtualitics we strive to create an inclusive culture based on compassionate values and yet at the same time rooted in a bottom line approach.” says Michael Amori, CEO & Co-Founder, Virtualitics.

“It is my honor to extend congratulations to the 2022 Best Places to Work winners,” says Sheridan Orr, Chief Marketing Officer, Built In. “This year saw a record number of entrants — and the past two years fundamentally changed what tech professionals want from work. These honorees have risen to the challenge, evolving to deliver employee experiences that provide the meaning and purpose today’s tech professionals seek.”
About Virtualitics
Virtualitics is a fast-growing startup providing AI-as-a-Service to help uncover key insights in data. Our software helps customers through a combination of machine learning, immersive data visualization, and a collaborative shared virtual environment. Our technology is based on a decade of research at Caltech (California Institute of Technology) and NASA’s Jet Propulsion Laboratory (JPL).
Guess what? We’re hiring — join us!
About Built In’s Best Places To Work
Built In’s esteemed Best Places to Work Awards, now in its fourth year, honor companies across numerous categories: 100 Best Places to Work, 50 Best Small Places to Work, 100 Best Midsize Places to Work, 50 Companies with the Best Benefits and 50 Best Paying Companies, 100 Best Large Companies to Work For, and 100 Best Remote-First Places to Work.
In 2011, the German government coined the term “Industry 4.0” to describe the growing application of automation and data connectivity to manufacturing and industrial processes. Today, the Fourth Industrial Revolution is in full swing, and machine learning is playing a pivotal role in advancing the movement.
Talk of artificial intelligence in manufacturing and industrial settings has always sparked fears that human workers will become obsolete. However, in practice, machine learning creates an opportunity for humans and technology to work in concert to achieve greater efficiency, resilience, and consistency.
The Demands of Industry 4.0 to Leverage Machine Learning
The power of applying machine learning to industry lies in the ability to leverage data in ways the human brain cannot accomplish alone. For the industrial sector to take advantage of machine learning, it requires historical and live data collection from various streams, aggregation of data from disparate sources, and integrated platforms for data analysis and 3D visualizations.
For example, a general Industry 4.0 use case may entail the following steps:
- Data is collected from sensors located at critical points in the manufacturing process.
- The data is transferred to the cloud, where it is analyzed using machine learning algorithms.
- The system generates multidimensional visualizations that provide a 360-degree view of the data, including process efficiencies and performance roadblocks.
- Operators use this information to trigger maintenance or optimize functions within the process.
At a broader scale, machine learning helps manufacturing and industrial organizations do everything, from better understanding their users’ needs to proactively initiating equipment repairs that prevent breakdowns in mission-critical systems.
The Impact of Machine Learning on Manufacturing
Machine learning enables systems and algorithms to improve by “learning” from experiences. This continuous adaptation in response to new and updated information allows manufacturing organizations to optimize their operational efficiency and their processes.
In recent years, machine learning technology has paved the way for smart factories. These highly connected facilities use Internet of Things (IoT) devices, sensors, software, and analytics to digitize the manufacturing process, continually monitoring production performance and capturing data. With this high volume of extremely targeted data available for analysis, machine learning enables stakeholders to make more informed decisions that result in more successful business outcomes.
6 Ways Machine Learning Makes Industry 4.0 Smarter
1. Real-Time Quality Control
Machine learning reduces incidents of manufacturing defects and quality issues by integrating with video streaming devices and smart sensors to assess product quality in real time throughout the manufacturing process.
Operators receive alerts about potential issues during production so they can correct them early. This level of inspection and error detection wouldn’t be feasible if it had to be done manually, so machine learning helps improve product quality and, by extension, customer satisfaction.
2. Reduced Downtime with Predictive Maintenance
Machine learning enables predictive analytics, which, in turn, makes predictive maintenance possible. Sensor-equipped components feed performance information to the machine learning system. Using AI routines and algorithms, machine learning tools detect the need for maintenance before a breakdown occurs, which minimizes downtime and reduces the expense of unplanned repairs.
3. Improved Performance
Pinpointing the root cause of performance issues can be tricky. Machine learning algorithms take data from equipment sensors and other unstructured data sources and create visualizations that make it easier to isolate the cause of problems within the system.
By identifying patterns and relationships that are often hidden within the data, machine learning tools make it possible to see how different system components and environmental factors impact performance so operators can quickly correct issues at the source.
4. Autonomous Machinery
Warehouse and factory work is notoriously dangerous for humans. Machine learning enables robotic operators to take over repetitive or high-risk tasks, which makes manufacturing and fulfillment processes safer and more efficient.
5. Demand Prediction
Miscalculating demand can lead to wasted time, effort, and product at one end and product shortages and customer dissatisfaction at the other. Machine learning allows operators to track and monitor historical data for demand and other influencing factors. This insight makes forecasting more accurate so production can be adjusted appropriately to reduce waste and maximize revenue opportunities.
6. Inventory and Supply Chain Management
Industry 4.0 relies on automated inventory and supply chain management tools to drive efficiencies and mitigate risk. Machine learning and IoT services provide real-time insights and visibility into inventory and supply chains so operators can identify bottlenecks early while proactively maintaining appropriate inventory levels.
Achieve Greater Efficiency, Productivity, and Reliability with Machine Learning
In today’s highly connected business environments, data is king. For the manufacturing and industrial sectors, machine learning makes it possible to harness the power of data to increase efficiency, increase critical system availability, and reduce costs.
With the rise of Industry 4.0, AI-driven visualizations are democratizing data analytics by making data accessible and understandable for all stakeholders, not just the data scientists.
Data can be a powerful tool in any industry. It enables companies to understand the past and predict what might occur in the future. Predictive analytics attempts to answer the question, what will happen next? It uses modeling and forecasting to make those predictions with high probability. Its use in healthcare is wide-ranging, and one of the most important areas it can impact is personalization of healthcare for better outcomes.
The Role of Predictive Analytics in Healthcare
Predictive analytics leverages AI and machine learning to analyze historical data and identify patterns. Next, predictive algorithms and training models evaluate data across multiple sources. That data can derive from electronic health records (EHRs), administrative channels, health surveys, claims databases, medical alert services, patient registries, patient-generated from devices, and disease registries.
That’s a substantial amount of data, and it is continually growing. One patient can generate 80 megabytes of data each year. However, the volume is only one obstacle. Healthcare data lives in silos, and there are many issues regarding data sharing. Healthcare organizations need a platform to aggregate data and create data visualizations so that insights are actionable. Attaining this can reduce healthcare costs, improve patient care, and forecast outcomes (e.g., risk of disease or complications).
Predictive Analytics Is Revolutionizing Personalized Care
Every person is unique, regardless of whether or not they suffer from the same diseases or ailments. Diagnosis, prognosis, and treatment all look different depending on the specific patient. There are many standards around these components of care, but the more personalized they can be, the greater the likelihood of positive outcomes.
Here’s how each segment can benefit from predictive analytics.
Using Predictive Analytics in Healthcare Diagnosis
Predictive analytics can determine a patient’s likelihood of cancer or other diseases. If patients receive an early diagnosis, they can begin care faster, which improves their survival chances.
Using Predictive Analytics in Patient Prognosis
Clinicians can apply predictive analytics to determine if recurrence of disease or readmission after a hospital stay is likely. With this prediction, proactive intervention can occur.
All organizations want to prevent hospital readmission. It has a negative impact on many operational areas and patients. Predictive data analytics can combine data from various sources to identify those patients who might have complications when they return home. The data would look at patient risk factors, including social determinants of health (SDOH), to identify those with a high probability of complications. If that’s the case, providers can coordinate a care plan to prevent readmission.
An example is researchers using physiological data from the hospital stays of patients with congestive heart failure. They looked at data from 10,000 patients, determining that it could predict medically adverse events like readmissions.
Using Predictive Analytics to Determine Treatment Options
Not every patient will react the same way to treatment. The application of machine learning-based predictive analytic models can support treatment for patients with acute and chronic diseases.
In more immediacy, predictive analytics can provide insights to physicians at the time of care with real-time clinical decision-making support.
Regarding medication, precision medicine and genomics are becoming more critical. Predictive analytics modeling and simulating inform clinical trials to optimize dosing, predict product safety, and identify possible side effects. Biotech firm Isoplexis uses predictive analytics to connect the mechanisms and outcomes of therapies and disease.
More Ways Predictive Analytics Can Support Personalized Care
In addition to diagnosis, prognosis, and treatment, predictive analytics can also model hospital staffing needs and the availability of critical care beds in a proactive approach. It can also track hospital-acquired infection rates, which is critical in mitigating spread. Finally, it can also work to predict the maintenance of equipment to prevent failures.
Challenges of Predictive Analytics in Healthcare
Healthcare data is different from any other category. Regulations, including HIPAA, define the parameters around security and privacy. That can often be a barrier to greater data access.
Another primary challenge is the lack of expertise and technology. Healthcare analysts need advanced platforms to operationalize their processes. Without buy-in from leadership, they won’t receive the funding they need for people and technology.
Finally, healthcare data suffers from poor quality. There are no standardizations across EHRs or databases. The data may also be inaccurate and full of duplicates. Without proper data hygiene, it’s hard to get meaningful results.
Solving Some of the Challenges of Predictive Analytics for Better Patient Care
Our AI-driven data analytics and 3D visualization platform can’t resolve all the challenges of healthcare data. It can support the healthcare industry by making predictive analytics accessible that doesn’t require data scientists to uncover insights and make accurate predictions.
Data can often seem abstract, hindering the opportunity for it to be actionable. The sheer volume of data makes it difficult to understand what it all means. To remove these roadblocks to leveraging data for better decision-making, many companies rely on data visualization.
Data visualization is a graphical representation of information. With “visuals,” you have a more accessible way to connect the dots and uncover trends, outliers, and patterns. Thanks to this approach, you don’t have to be a data scientist to recognize the data’s story. You can more easily analyze your troves of data, leading to better, more informed results.
Data Visualization Is an Important Tool for Businesses
Humans are visual creatures. We all learn in different ways, but visualizations help us all comprehend faster.
Consider these two options: a graphical representation with color-coding that maps out data vs. a spreadsheet full of information. Which one is going to be more advantageous? Most people would agree that it’s the latter, which can work for anyone because most people who need to evaluate data to make decisions aren’t data scientists.
The ability to package up data is also critical because the amount of data generated daily is massive. In 2020, the data created, captured, copied, and consumed globally reached 64.2 zettabytes. By 2025, the expectation is that it will grow to 180 zettabytes. A variety of technology pieces are fueling this growth, including IoT (Internet of Things) devices, the proliferation of digital transformation in every industry, and the ability to track just about anything.
As a result of this avalanche of data, you need to organize and accelerate its speed to value with data visualizations. In such models, insights are easier to absorb.
Multi-Dimensional vs. Traditional Visualizations
Data visualizations aren’t a new concept. What’s happening now is the transition from 2D visualizations to 3D. Two-dimensional visualizations may occlude critical data points, meaning that the trends you hope to identify don’t stand out in many cases. It’s not much better than just looking at the rows in a spreadsheet.
Conversely, 3D visualizations enable users to explore the “why” behind the data. They can add and change up variables to observe how those will impact the target data.
This immersive data visualization takes the static and transforms it into a multi-dimensional experience that enables drill-downs and interaction. The model allows you to view the data from any angle. Having this type of tool provides any company with a path forward to data-driven decisions and helps solve various challenges, including siloed operational data, distributed team collaboration, and missed growth opportunities.
With these visualizations, you can break down complex data analysis on large datasets so that it’s possible to take action on the “why.”
Data Visualization Use Cases
Many verticals can find immense value in data visualizations. In determining when to use it, there are no written rules. Applying visualizations to large datasets makes sense, but they also work well when seeking to identify causation when there are many variables. Here are some use case examples from various industries or functions.
- Sales: The sales pipeline is a big deal for organizations, but visibility into it for managers and leaders can be murky sometimes. The pipeline and deal stages are more apparent with data visualizations, improving forecasting and alignment with sales goals.
- Marketing: Use data visualizations to understand consumer behavior to find out what influences it. By doing so, you can better target your audience.
- Energy: Data visualization is driving change in the energy sector, supporting forecasting, root cause analysis, predictive maintenance, and more.
- Healthcare: Both payers and providers want to learn more about data regarding the health of patients. Data visualizations can support a variety of stakeholders. Providers can develop 3D visualizations to understand public health trends more clearly and improve patient care. Payers could use these to more reliably predict the potential for certain claims.
- Biotech: Researchers can manage large datasets through 3D models and insert different variables when developing new medications. That can continue to add new data based on trials to find “aha” moments.
- Finance: Financial institutions can leverage visualizations in many ways, from business intelligence to fraud identification.
- Transportation and logistics: Better routing saves companies time and money. With 3D visualizations, they can incorporate all types of data—fuel sensors, mileage logs, GPS, and so on—to find the most efficient routes.
- Defense: In the defense field, predictive maintenance data visualizations help reduce downtime and maintenance costs.
How Can Data Visualizations Move Your Organization Forward?
With the right technology platform, data visualizations don’t have to be complex. You can create environments to discover new dimensions of data never accessible before.